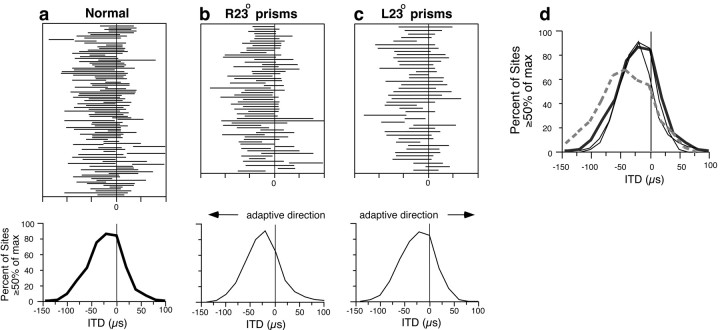
Fig. 5.
Representation of ITD in the nOv of normal and prism-reared owls. Top, Each horizontal line represents data from a single site and indicates the range of ITD values that elicited at least 50% of the maximal response for that site. Negative ITD values represent left-ear leading; positive ITD values represent right-ear leading. Bottom, Composite ITD–response curves for broadband (3–12 kHz) stimuli, summarizing the data shown above. a, Five normal owls, 100 sites;b, three owls raised with R23° prisms, 70 sites;c, two owls raised with L23° prisms, 43 sites;d, composite ITD–response curves for broadband (3–12 kHz) stimuli representing normal owls (thick solid line), prism-reared owls (thin solid lines), and device-reared owls (thick dashed line) (data from Fig.3h).

