Fig. 3.
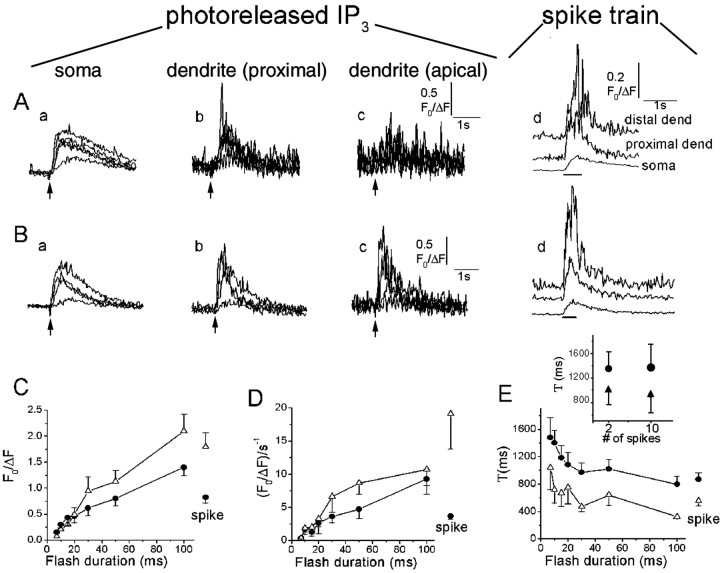
Ca2+ signals evoked by photorelease of increasing amounts of IP3.A, Records from a strongly responding neuron, illustrating different spatial patterns of Ca2+signals evoked by photorelease of increasing amounts of IP3. Superimposed traces in the first three panels show fluorescence signals recorded from the soma (a; excluding nucleus), proximal dendrite (b; within 10 μm of the soma), and distal dendrite (c; 50 μm from soma), in response to photolysis flashes with durations of 7, 10, 15, and 20 msec. The right panel (d) shows corresponding responses in each region to trains of action potentials. B, Similar records from another neuron, in which large responses were observed in the distal dendrite. Flash durations were 7, 10, 20, and 50 msec. C, Mean peak amplitude of fluorescence signals in the soma (filled circles) and proximal dendrite (open triangles) of 11 strongly responding neurons, plotted as a function of photolysis flash duration. Amplitudes of signals evoked by spike trains in the same neurons are shown at theright. Error bars indicate 1 SEM. D, Corresponding measurements of rate of rise (F0/ΔFsec−1) of the fluorescence signals. Only suprathreshold Ca2+ responses were included in calculating the averaged values. E, Time constants of decay of fluorescence signals in the same neurons, derived from single-exponential fits to the decay phase of the IP3-evoked Ca2+ responses.Inset shows the Ca2+ decay time constants for a single spike and a train of 10 spikes, measured in both the soma and dendrite of a separate population of neurons (n = 5).

