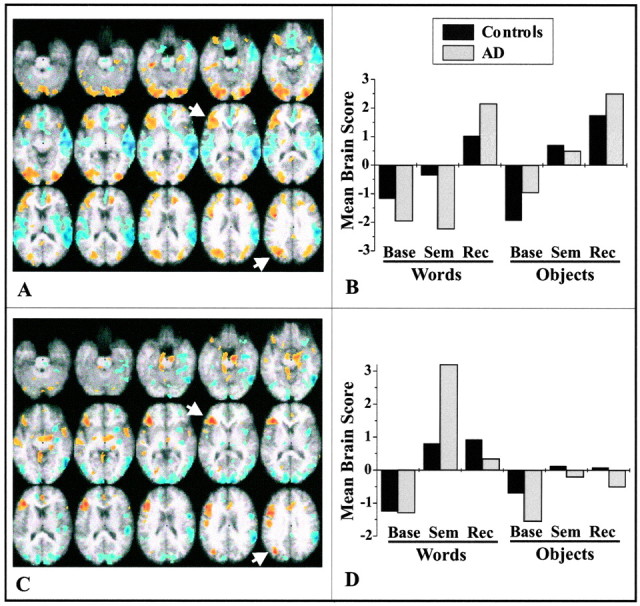
Fig. 2.

Changes in brain activity related to task for controls and AD patients. The images in A (LV1;p < 0.001) and C (LV2;p = 0.002) show the active areas on a standard magnetic resonance imaging scan in which the right side of the brain is shown on the right side of the image. The brain slices begin at −28 mm relative to the anterior commissure–posterior commissure line (top left image) and end at +28 mm (bottom right image) with a 4 mm slice separation. Thegraphs in B and D show the mean brain scores for controls and AD patients on the LVs. Positive mean brain scores were found in those conditions in which activity was increased in the brain regions shown in red andyellow (i.e., those with positive salience on the LV). Negative mean brain scores were found in those conditions in which activity was increased in the brain regions shown inblue (those with negative salience on the LV).Arrows point to the regions of left VLPFC and extrastriate cortex used in subsequent analyses. Maxima of regions with increased activity during the semantic and recognition tasks (salience/SE ≥ 3.0) are shown in Table 2. Base, Baseline task; Sem, semantic task; Rec, recognition task.
