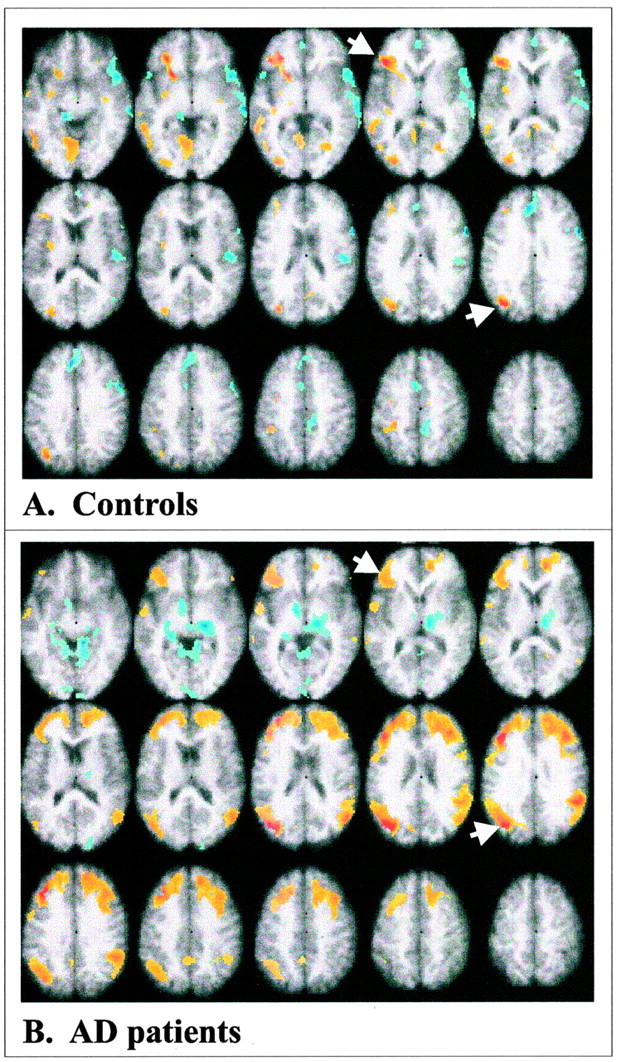
Fig. 3.

Functional connectivity of left VLPFC and GOs. A, Connectivity in the control group;B,connectivity in the AD patients. The VLPFC voxel in both groups was x −36, y 28, andz 4, and for the extrastriate region the voxel used wasx −34, Y −72, and z 28 (indicated bywhite arrows). Positive correlations are shown inyellow and red, and negative correlations are shown in blue. Maxima of regions with positive correlations for the controls (salience/SE ≥ 3.0) are given in Results, and maximum regions of positive correlation for the AD patients are shown in Table 4.
