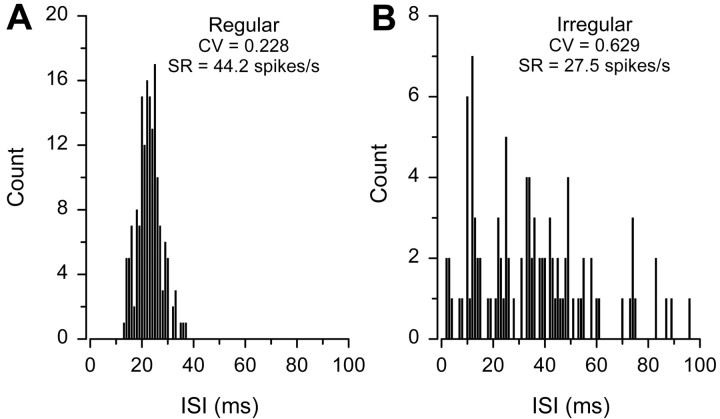
Fig. 2.
Resting discharge patterns of auditory saccular afferent neurons recorded from female midshipman. Representative ISI distributions are shown for both regular and irregular resting discharge patterns. Discharge variability is expressed as the coefficient of variation (CV), a dimensionless ratio of SD to mean ISI duration. SR, Spike rate. Bin width = 1 msec.

