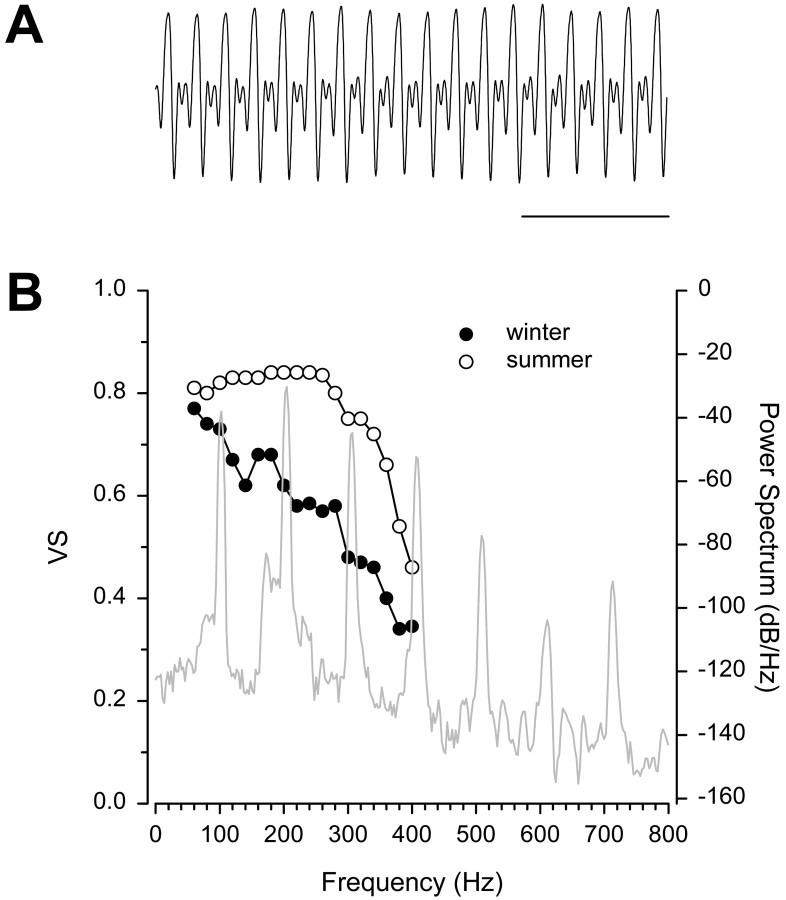
Fig. 9.
A, Representative example of a hum recorded at 16°C from a nesting type I male midshipman,P. notatus. Calibration: 50 msec.B, Match between the power spectrum of the representative hum (A) and the frequency sensitivity of female auditory saccular afferent neurons recorded during the winter and summer. Iso-intensity curves are based on vector strength (VS) of synchronization to iso-intensity tones of 130 dB (re 1 μPa) and show median VS values for females recorded during the winter (●; from Fig. 5A) and summer (○; from Fig. 5B).

