
Fig. 5.
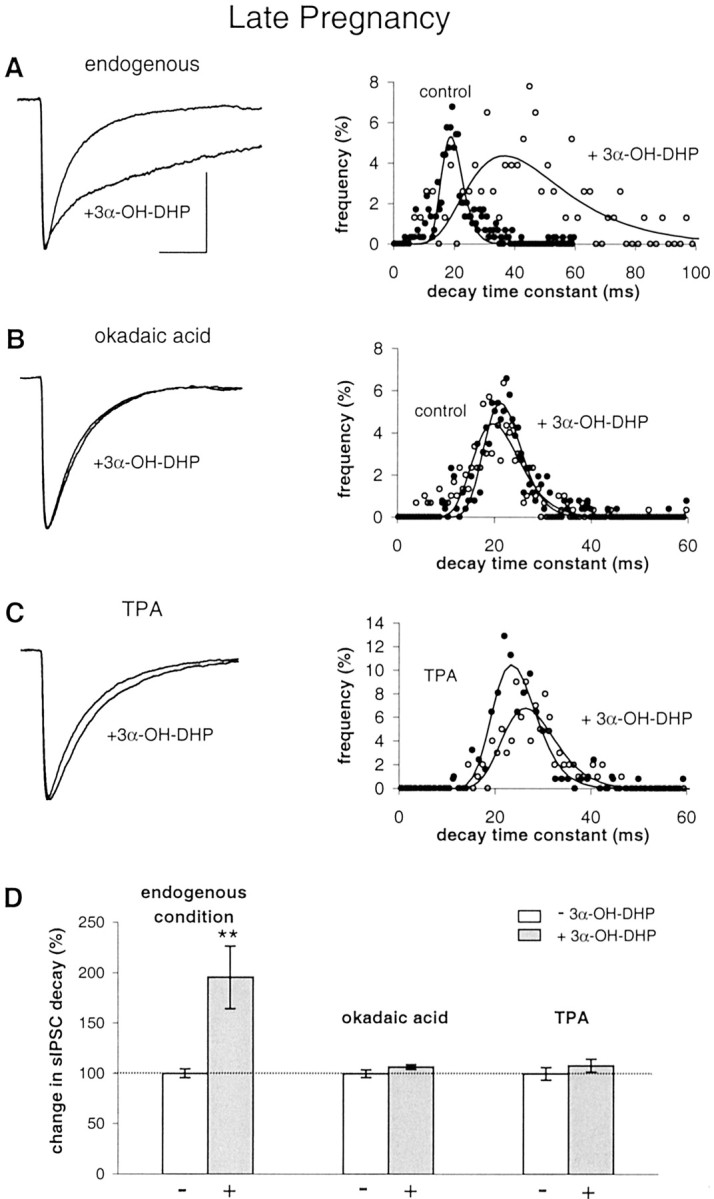
Experimental induction of neurosteroid resistance at late pregnancy. A, Left, Average sIPSCs obtained in SON neurons at P20 showing a large 3α-OH-DHP effect under endogenous conditions using unbuffered pipette medium.Right, Histogram of the sIPSC decay time constants of experiment shown on the left. B, Average sIPSCs in the absence and presence of 3α-OH-DHP and histogram showing that phosphatase inhibition prevents 3α-OH-DHP effect on sIPSC decay.C, Average sIPSCs in the absence and presence of 3α-OH-DHP and histogram showing that PKC activation also prevents 3α-OH-DHP effect on sIPSC decay. D, Summary graph illustrating the relative effects of 3α-OH-DHP on sIPSC decay time constants under the endogenous condition (to 196 ± 31% of control; p < 0.01; n = 6), after phosphatase inhibition (107 ± 2%; p > 0.05; n = 6), and after PKC activation (108 ± 6% compared with during TPA pretreatment; p > 0.05; n = 7). TPA application did not affect sIPSC decay itself (104 ± 3% of control; p > 0.05; n = 6). However, it did significantly suppress the average sIPSC amplitude to 65 ± 9% of control values (p < 0.05; n = 6), which corresponds to previous findings in this cell system (Brussaard et al., 2000). sIPSC decay was not different in okadaic acid (n = 6) compared with in experiments without the drug (n = 22; 108 ± 2%; unpairedt test; p > 0.05). All other traces of average sIPSCs were plotted normalized to the control average inA. Calibration (of the control trace), 20 msec, 100 pA.