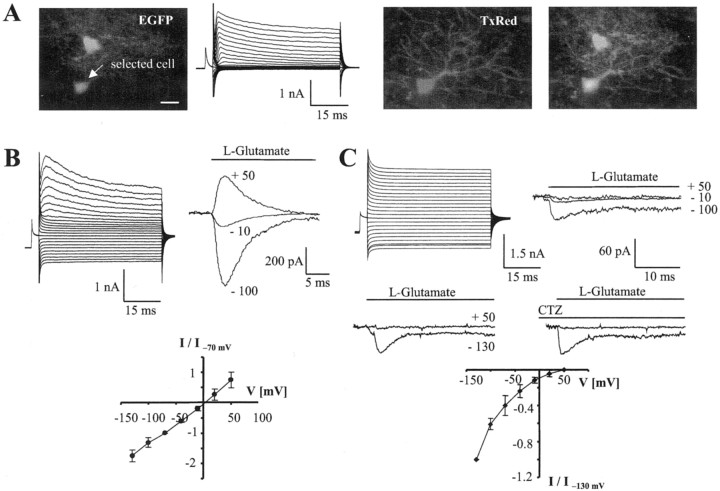
Fig. 4.
Properties of GluR cells and GluT cells in situ. A, Distinct intrinsic fluorescence of a GluT cell (top) and a GluR cell (arrow) in the CA1 stratum radiatum of a P12 mouse (left). Whole-cell currents were obtained from the GluR cell (see Fig. 1 for stimulation protocol, KCl-based pipette solution). During recording, the cell was filled with Texas Red-conjugated dextran, revealing thin, branched processes that were not visible in the EGFP image. Superposition of the fluorescence images demonstrated a close association of both astrocytes (right).B, Current pattern of another GluR cell (P12). Intracellular replacement of KCl with KSCN gave rise to a prominent resting conductance. Subsequently, an outside-out patch was excised from the cell, and glutamate was rapidly applied to the patch at different membrane potentials (top right). To get meanI–V relationships, the responses of different cells (n = 10) were normalized to the respective peak amplitudes at −70 mV and averaged (bottom). C, A GluT cell (P18) was investigated as described in B. Note the absence of outward currents after glutamate application to the outside-out patch (top right). Even preapplication of CTZ to the patch failed to disclose any glutamate responses at positive voltages (middle). The I–V curve gives mean values obtained from different GluT cells (n = 6) after normalizing to maximum currents at −130 mV (bottom).

