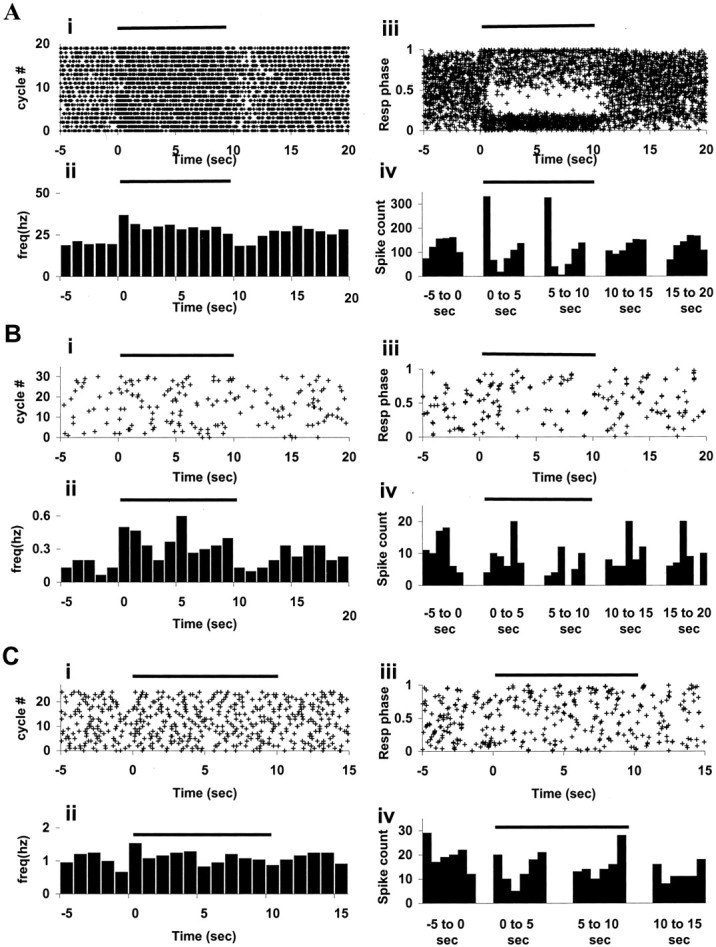
Fig. 5.

Odor response properties of neurons from OB and HC. Horizontal line at top of each plot indicates the duration of odor delivery (10 sec, starting at 0 sec and going on until 10 sec). A, OB mitral–tufted cells. Plots in i and ii are for neuron 16, and those in iii and iv are for neuron 11. ROC-Raster (i) and ROCPSTH (ii) show sustained firing rate increase in response to odor delivery (p < 10−15). Bin width for ROCPSTH is 1 sec. PSRPR (iii) and PSRPH (iv) show respiration tuning change in response to odor presentation (p < 10−15). B, HC, CA1 pyramidal cells. Plots in i and ii are for neuron 70, and those in iii and iv are for neuron 49. ROC-Raster (i) and ROCPSTH (ii) (bin width 1 sec) show firing rate change in response to odor presentation (p = 0.0036). PSRPR (iii) and PSRPH (iv) show respiration tuning change during odor presentation (p = 0.03). C, HC, CA3 pyramidal cells. Plots ini and ii are for neuron 47, and those iniii and iv are for neuron 41. ROC-Raster (i) and ROCPSTH (ii) (bin width 1 sec) show firing rate change during odor delivery (p = 0.02). PSRPR (iii) and PSRPH (iv) show respiratory tuning change during odor delivery (p = 0.025). Note that the time scale for C goes from −5 to 15 sec only, because the odor runs were of the shortest duration: 8 sec air, 10 sec odor, and 2 sec purge. For additional elaboration on the response properties of pyramidal cells from CA3, see Results. For details of analysis, see Materials and Methods.
