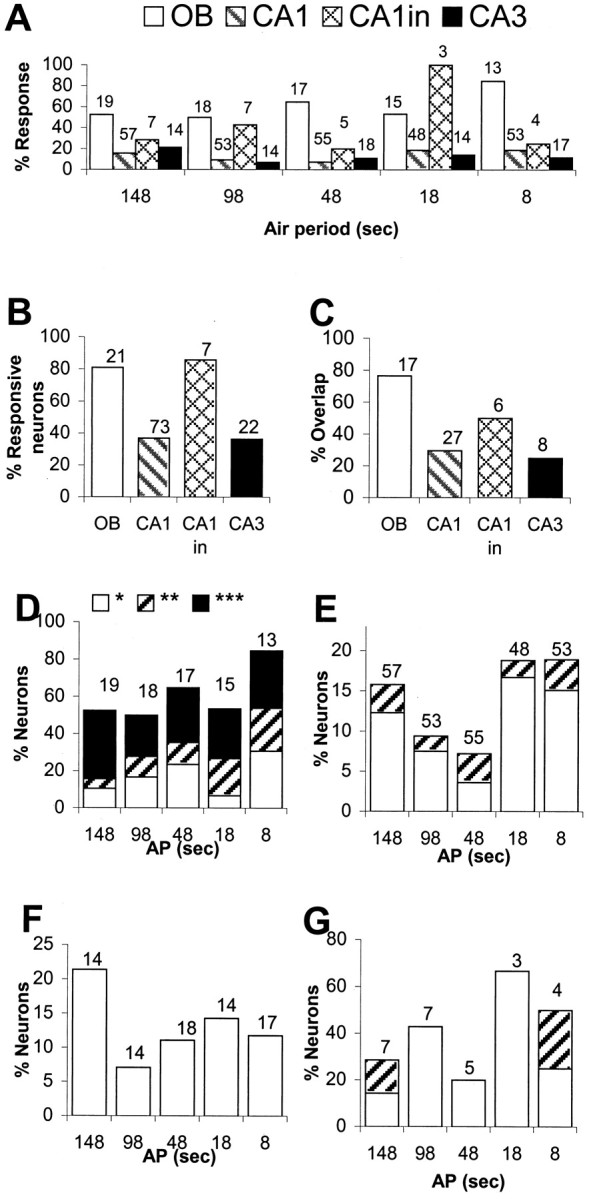
Fig. 7.

Odor response properties of OB and HC neurons.A, Percentage of OB mitral–tufted cells (OB), HC CA1 pyramidal cells (CA1), CA1 interneurons (CA1in), and CA3 pyramidal neurons (CA3) responding to odor delivered at different APs.Numbers at top of each bin represent total number of neurons tested. B, Percentage of neurons responding to odor during at least one of the five runs at different APs. Numbers at top of each bin are total numbers of neurons tested. C, Percentage of odor-responsive neurons that respond to odor delivered at more than one AP. Numbers at top of each bin are total number of neurons that respond to odor delivered at one or more APs.D–G compare the significance levels of responses, as estimated using ANOVA, to odors delivered at a range of APs.Blank portions of the bars indicate percentage of neurons responding at significance levels of 0.01 <p < 0.05 (*). Hatched portions of the bars indicate percentage of neurons responding at significance levels of 0.001 < p < 0.01(**).Solid portions of the bars correspond to percentage of neurons responding at significance levels ofp < 0.001 (***). Total number of neurons, shown attop of each bin, is same as indicated inA. D, OB mitral–tufted cells.E, CA1 pyramidal cells. F, CA3 pyramidal cells. G, CA1 interneurons. Note the different scales for neuronal response percentages in D–G.
