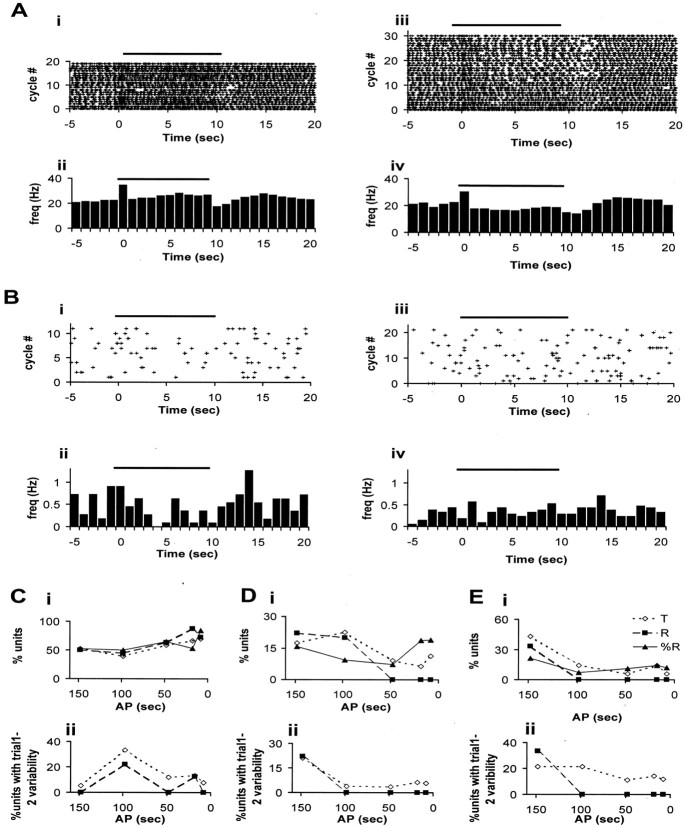
Fig. 9.
Variability in odor responses. A, ROC-Rasters and ROCPSTHs of OB mitral–tufted neuron 16 showing variability in its odor response as a function of AP. i,ii, AP, 98 sec; ii, iv, AP, 18 sec. The neuron gives statistically significant responses in both cases (one-way ANOVA; p = 1.9 × 10⁻¹⁵ for 98 sec AP and p = 4 × 10⁻¹⁴ for 18 sec AP) but shows higher variability at 18 sec AP, as seen from the ROCPSTH. The decrease in odor-stimulated firing in Aii is suggestive of habituation. B, ROC-Rasters and ROCPSTHs of a CA1 pyramidal cell responding to odor at 98 sec AP (i andii) and not responding to the same odor at 18 sec AP (iii and iv). One-way ANOVA;p = 0.038 and p = 0.7, respectively. C–E show variability measured using two-way ANOVA. The percentage of odor-responsive neurons satisfying a criterion of p < 0.05 is plotted for comparison.Open diamonds represent percentage of total (T) neuronal population showing trial-to-trial variability. Filled squares correspond to percentage of odor-responsive (R) neurons showing trial-to-trial variability. Filled triangles represent percentage of neurons showing statistically significant odor responses (%R). C, OB mitral–tufted cells.D, CA1 pyramidal cells. E, CA3 pyramidal cells. For C–E, i, Plot of percentage of neurons showing trial-to-trial variability as a function of AP for all trials starting from the second trial; ii, plot of percentage of neurons showing trial-to-trial variability between the first two trials as a function of AP.

