
Fig. 3.
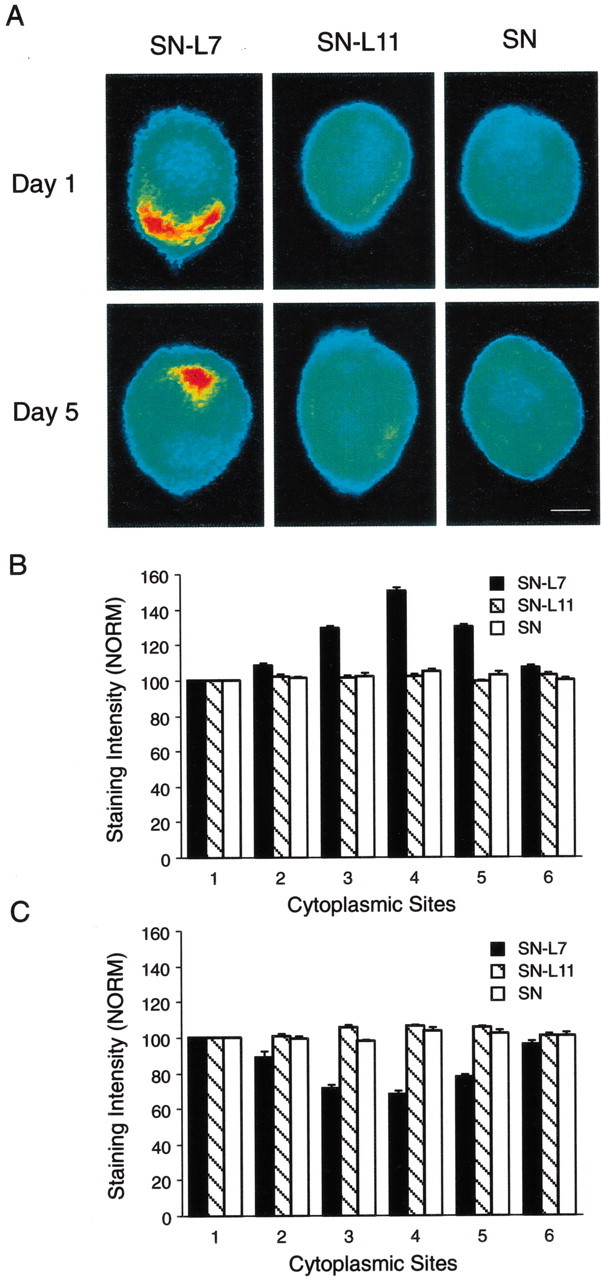
Target interaction regulates the distribution of syntaxin protein in SN cell bodies. A, Each micrograph is a pseudocolor representation of immunocytochemical signals (red is high intensity; blue is low intensity) for syntaxin in SNs cultured with L7, L11, or alone for 1 or 5 d. The SN axons emerge at the 6 o'clock position. Syntaxin accumulates in the region of the axon hillock on day 1 but is excluded from this region on day 5. Scale bar, 25 μm. B,C, Syntaxin accumulates at the axon hillock region of SNs only after 1 d in culture with motor cell L7 (B). At 5 d in culture, syntaxin appears to be excluded from the axon hillock region but is distributed uniformly when SN is not forming synapses (C). The histograms summarize relative intensity at five sites (2-6 corresponding to 2, 4, 6, 8, and 10 o'clock positions, respectively) compared with site 1(12 o'clock position). The height of each bar is the mean ± SEM from 6–10 cultures for each condition at each time point. An ANOVA (two-factor) at each time point indicated a significant difference in the signal intensity for syntaxin at day 1 (df = 10, 95;F = 8.514; p < 0.001) and at day 5 (df = 10, 90; F = 8.168;p < 0.001). Interaction with L7 after 1 d resulted in significantly greater levels of expression at positions3, 4, and 5 (4–8 o'clock) compared with interaction with L11 (F values from 11.826 to 17.444; p < 0.01) or SNs in culture alone (F values from 11.840 to 16.464;p < 0.01). By day 5, interaction with L7 resulted in significantly lower levels of syntaxin expression at positions3, 4, and 5 (4, 6, and 8 o'clock) compared with interaction with L11 (F values from 10.999 to 15.993; p < 0.01) or in SNs cultured alone (F values from 9.210 to 14.878;p < 0.01).