Fig. 4.

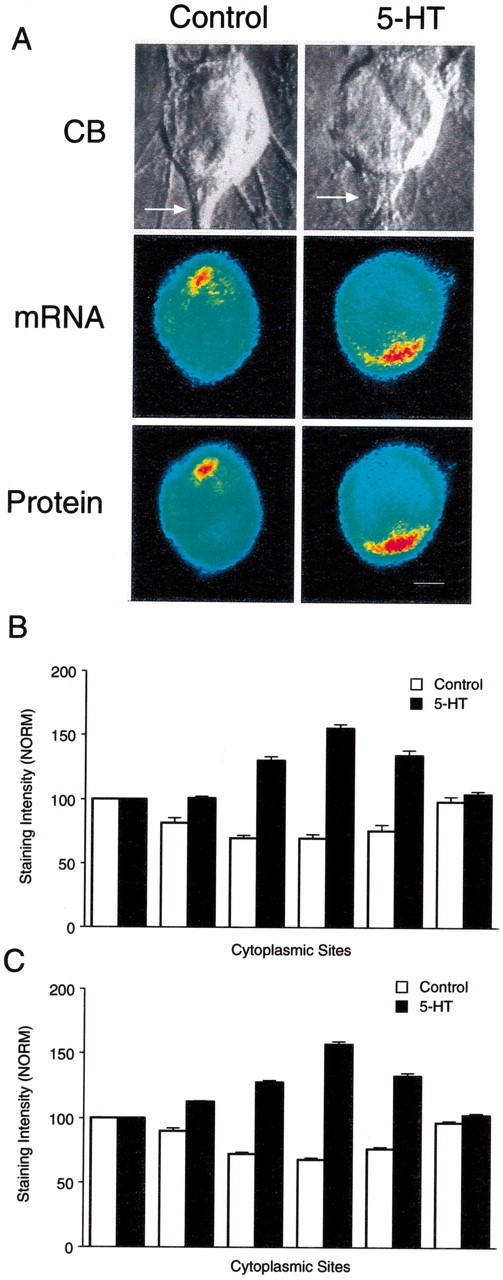
Distribution of syntaxin mRNA and protein is altered on day 5 by 5-HT that produces LTF. A, Double-label images reveal parallel distributions for syntaxin mRNA (in situ hybridization) and protein (immunocytochemistry) in SN cell bodies. The top micrographs are Nomarski contrast images of each SN cell body and initial axon segment. The middle micrographs are pseudocolor representations of in situ hybridization signals for syntaxin mRNA in these SNs fixed 24 hr after control or 5-HT treatments. The bottom micrographs are pseudocolor representations of immunocytochemical signals for syntaxin in the same SNs. Syntaxin mRNA and protein accumulate in the region of the axon hillock after 5-HT is applied to cultures with stable connections but remain excluded from this area with control treatment. Scale bar, 20 μm. B, C, The histograms summarize the effects of 5-HT on the distribution of syntaxin mRNA (B) and protein (C). The height of each bar is the mean ± SEM from 10–18 cultures for each treatment in each assay. They include cultures analyzed with the double-label procedure (4 cultures for each treatment). An ANOVA (two-factor) indicated a significant difference in the signal intensity for syntaxin mRNA (df = 5, 130; F = 56.088; p < 0.001) and protein (df = 5,120;F = 114.046; p < 0.001). Treatment with 5-HT resulted in significantly higher levels of expression of syntaxin mRNA (B) at positions3, 4, and 5 (4–8 o'clock) compared with controls (F values from 8.294 to 16.315; p < 0.01). Treatment with 5-HT also resulted in significantly higher levels of syntaxin protein expression (C) at positions 3,4, and 5 (4–8 o'clock) compared with controls (F values from 23.612 to 28.509;p < 0.01).
