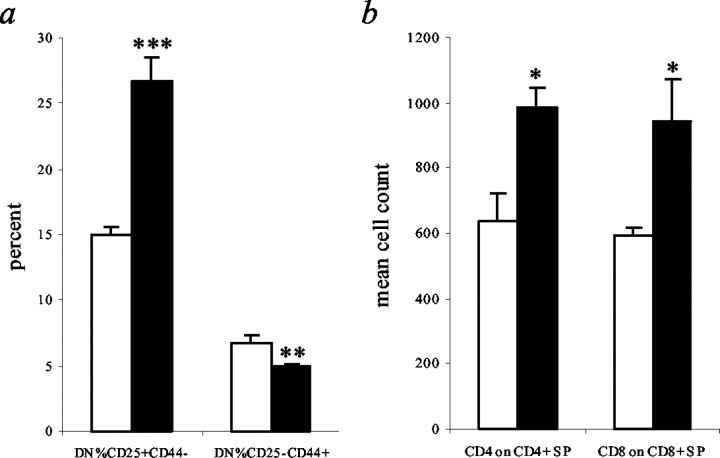
Fig. 3.
Thymocyte development abnormalities in robotic mice. Flow cytometric analysis of littermate control (white bars) and robotic (black bars) thymus at 3 week of age (n = 3). Data for immature T cell markers CD25/CD44 (a) and average SP CD4/CD8 expression (b) are shown as the mean + SEM. Two-tailed Student's t test: *p < 0.05, **p < 0.03, ***p < 0.01.

