
Fig. 2.
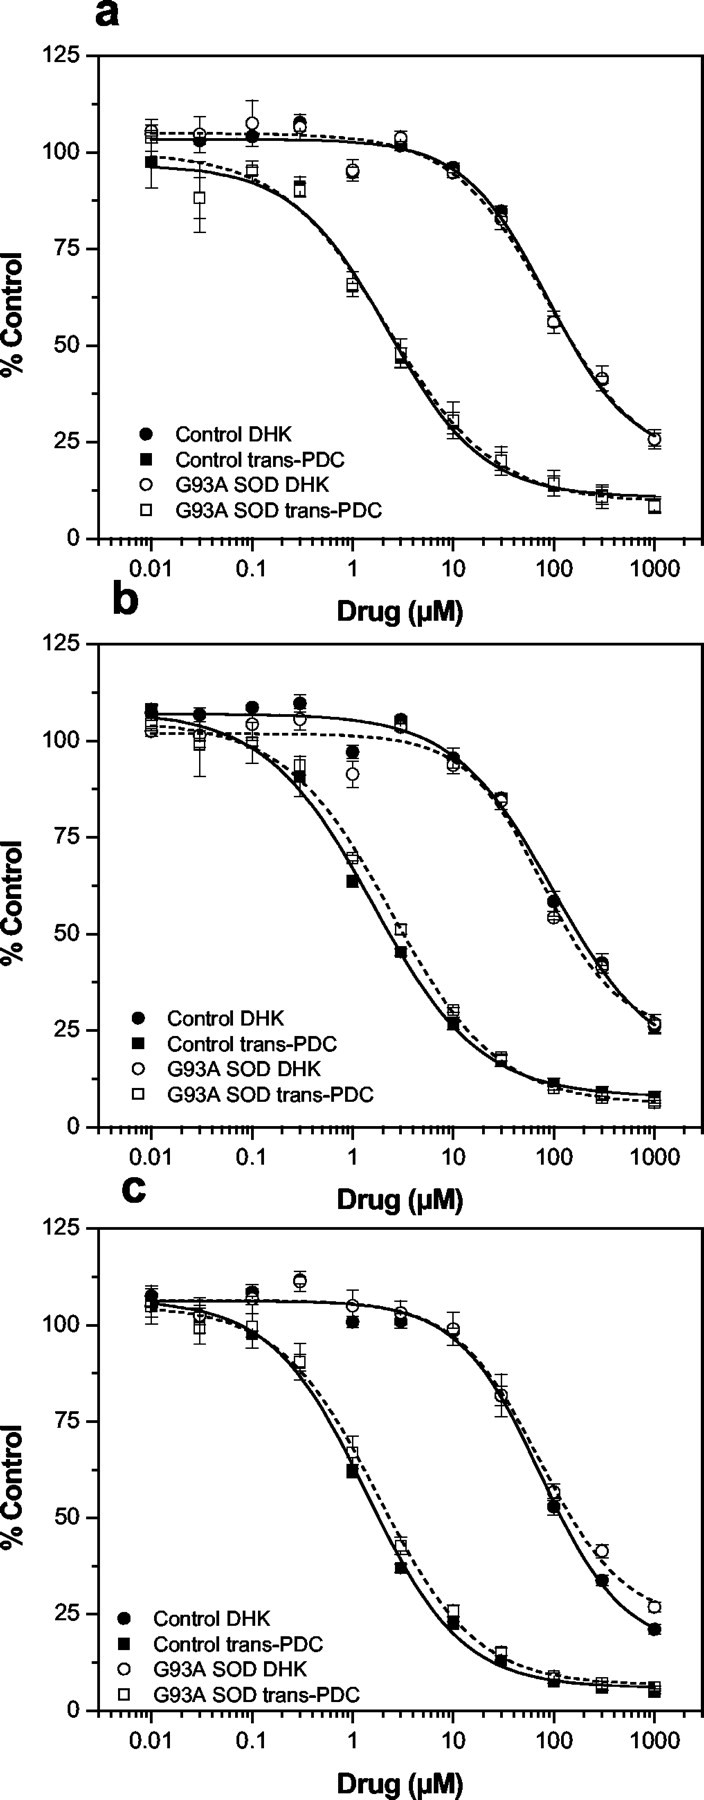
Log concentration–response curves for the inhibition of glutamate uptake into spinal cord synaptosomes prepared from G93A transgenic rats and age-matched controls. Glutamate uptake into P2 synaptosomal fractions prepared from presymptomatic (a), disease onset (b), and end-stage (c) G93A rats, together with age-matched controls, was measured in the absence and presence of the nonselective transport inhibitor trans-PDC or the selective GLT-1/EAAT2 inhibitor DHK. Solid lines depict data from control animals, and dashed lines rep resent the G93A data. The net Na+-dependent glutamate uptake values were expressed as a percentage of the activity observed in the absence of drug, and IC50 values were determined from the log concentration–response curves by nonlinear regression analysis using the four-parameter logistic function. Averaging the percentage control values obtained from three independent experiments generated each curve shown, and the IC50 values are summarized in Table 2.