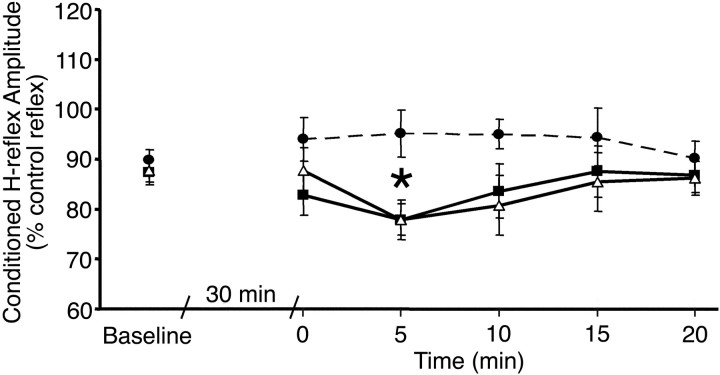
Fig. 1.
Effect of stimulation paradigms on reciprocal inhibition of the SOL H-reflex. Ten test and 10 conditioned reflexes were averaged at each time point for each subject. Group means and SEs are plotted before and after the patterned (triangles; n = 18), combined (squares; n = 14), and uniform (circles with dashed line;n = 8) stimulation sessions. *p< 0.01 indicates interval identified in post hoctesting as significantly different from baseline (Fishers test).

