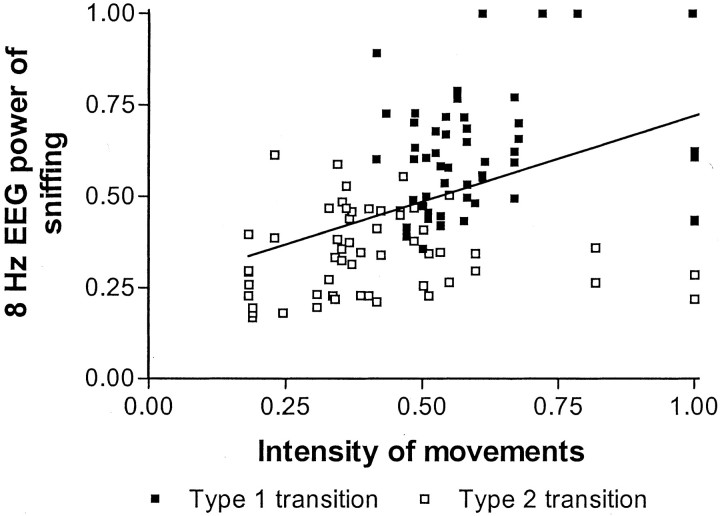
Fig. 5.
Regression analysis of intensity of movements and 8 Hz power of sniffing. For each rat, each time segment, and for both after and before transition, data points of intensity of movements were plotted against 8 Hz EEG power of sniffing. Transitions between sniffing and type 1 behavior are represented by filled symbols; transitions with type 2 behavior are represented byopen symbols. Intensity of movements and 8 Hz EEG power were positively correlated; r = 0.453. Data points of type 1 transitions are on average above the regression line, and data points of type 2 transitions on average under the regression line.

