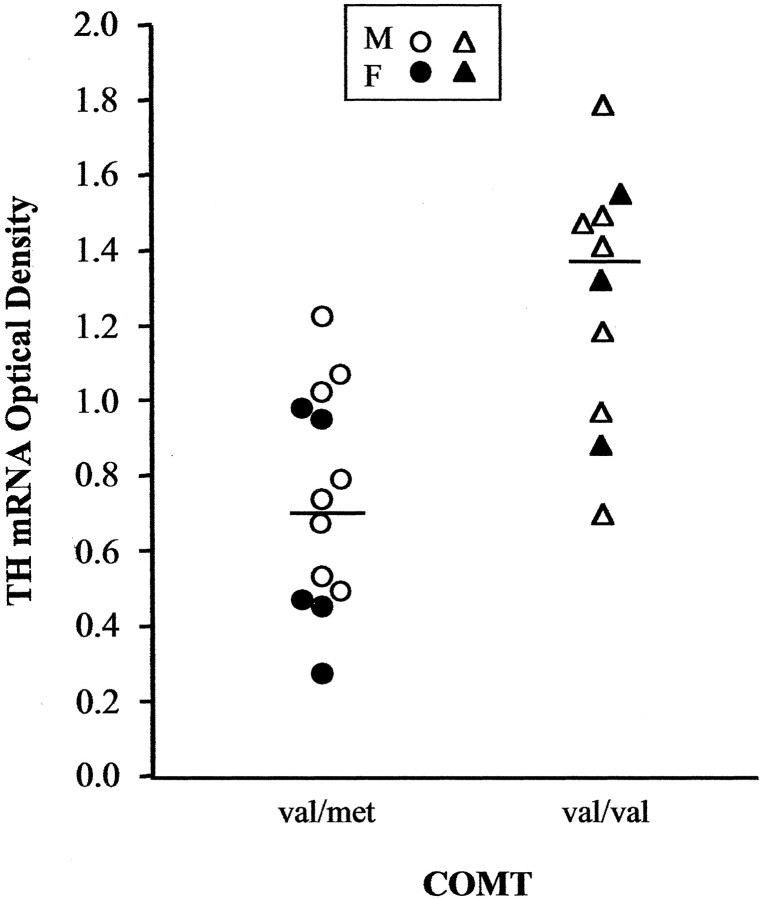
Fig. 3.
Comparisons of mean optical density, reflecting TH mRNA levels, between subjects with val/met (circles) and val/val (triangles) genotypes in the SNV. Eachsymbol indicates the mean value for one male or female subject (open and filled symbols, respectively), and horizontal lines indicate group means.

