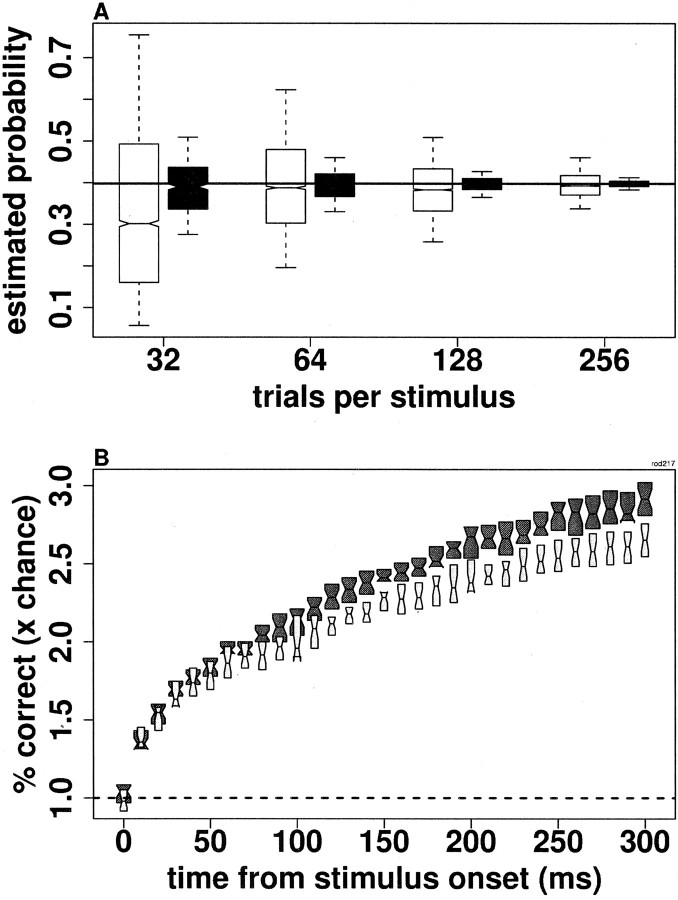
Fig. 10.
Decoding using the mixture-of-Poissons method is inferior to spike count decoding when there are no timing differences among responses to different stimuli. A, Mixture-of-Poissons decoding converges to the correct answer less quickly than does spike count decoding in a two-stimulus example with identical PSTH for both stimuli. x-Axis, Number of trials per stimulus. y-Axis, Distribution of estimated probabilities that a train with seven spikes arose from a homogeneous Poisson process with a mean of 4 spikes rather than from one with a mean of 10 spikes. The left (open)box in each set shows results using the mixture-of-Poissons decoding method. The right(filled) box shows results when decoding on the basis of spike count alone. The simulated data were generated by a homogeneous Poisson process with a mean of 4 for one stimulus and a homogeneous Poisson process with mean of 10 for the other stimulus. The mean number of spikes for each process was held fixed while the number of trials changed. Similar results were obtained using inhomogeneous Poisson processes as long as the rates varied in time in the same way (i.e., the normalized PSTHs were the same for the two processes). The left box in each set represents 2500 values, the results of decoding 500 randomly generated test trains using models derived from five different sets of simulated data. Theright box represents 250 values, the result of decoding the response “seven spikes” according to the models derived from 250 sets of simulated data (using additional sets of simulated data does not change the results). Interpretation of box plots: The line at the center of eachbox shows the median estimated probability, and thenotch shows a 5% confidence interval for the median. The bottom and top of thebox show the 25th and 75th percentiles, and thebottom and top whiskers show the 5th and 95th percentiles. B, x-Axis, Time from stimulus onset (milliseconds). y-axis, Number of trials correctly decoded (as a multiple of chance) using the spike count only (dark boxes) and the mixture-of-Poissons method (light boxes). Each box plot represents results from 25 artificial data sets with spike distributions modeled on those from one of the neurons from the experiment with 16 stimuli and no differences in the timing of stimuli as above. Interpretation ofbox plots is as above (whiskers removed for visibility).

