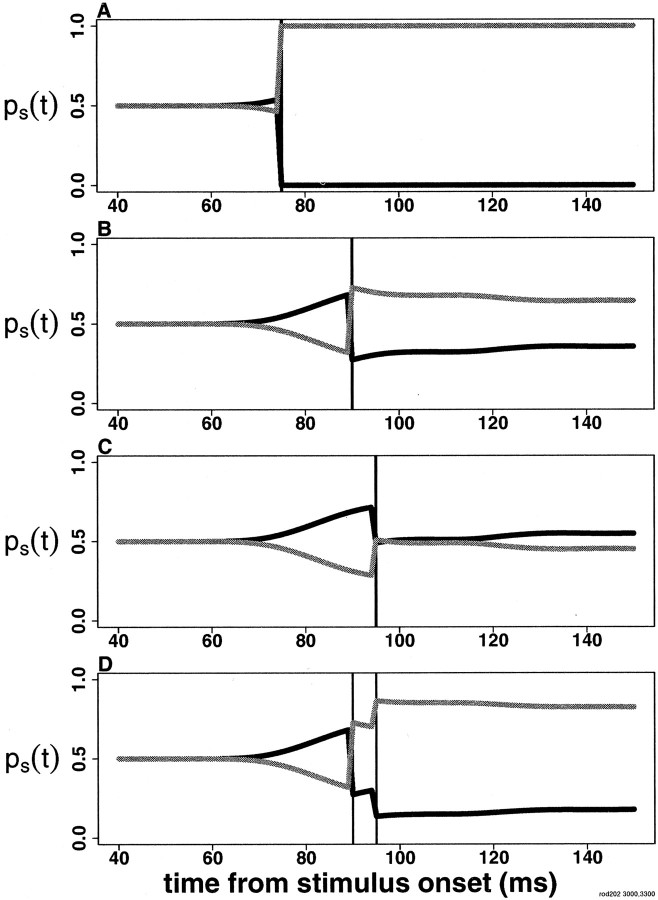
Fig. 3.
Decoding responses for the example of Figure 1.Labels correspond to equations in Materials and Methods.Black and gray are as in Figure 1.x-Axis, Time (milliseconds); vertical lines, 75, 90, and 95 msec after stimulus onset.y-Axes, Probability. A, Stimulus probabilities, ps(t), from decoding a spike train with a single spike at 75 msec, when only one stimulus ever elicits spikes. B, Decoding a spike train with a single spike at 90 msec. The probability of ablack stimulus rises between 70 and 90 msec after onset, because early spikes are more likely from the graystimulus, and none appear. C, D, Interpretation of a spike 95 msec after stimulus onset depends on whether there was an earlier spike. The decoding algorithm does not look into the future, so B–D are identical until 90 msec after stimulus onset, and B and Dare identical until 95 msec after stimulus onset.

