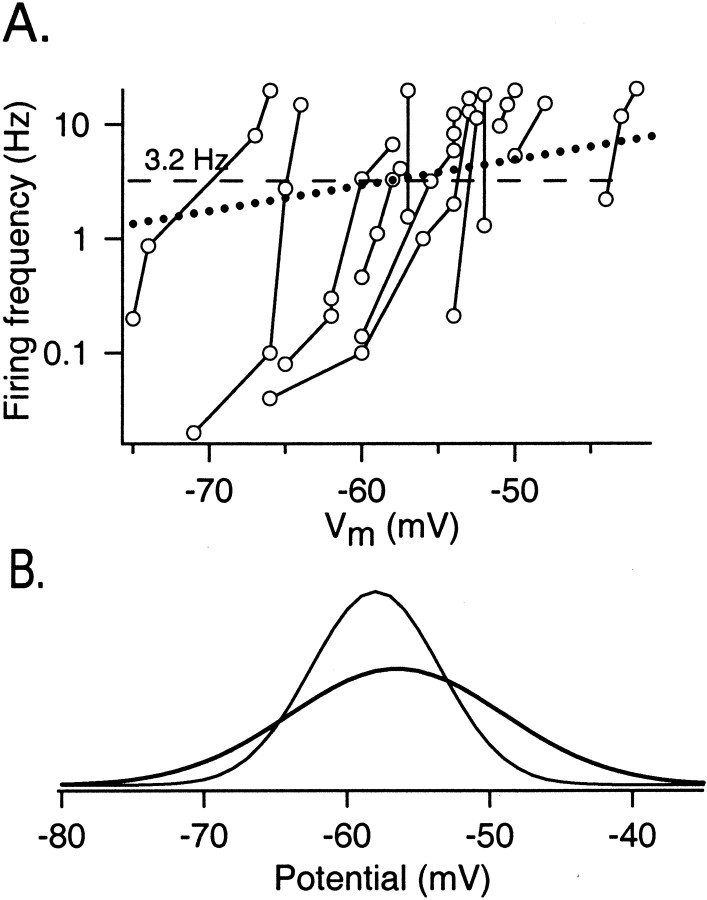
Fig. 2.
Determination of the equal firing potential in interneurons. A,f–Vm curves. Interneurons were recorded in the current-clamp mode with the gramicidin-perforated patch configuration. The holding current was set in each cell so that its mean firing frequency lay in the range of 0.1–20 Hz. For each holding current, the mean frequency is plotted against the mean potential of the cell. Points joined by aline belong to the same cell. The equal firing potentialVeq is the intersection of thef–Vm curve of each cell either with the line f = 3.2 Hz (dashed horizontal line), corresponding to the mean firing frequency as measured in cell-attached experiments, or with thefCA–VCA curve (dotted line; calculated according to Eq. 8; see). Veq = –56.5 ± 7.5 mV (n = 12); this is our best measurement of the mean membrane potential of the interneurons in this preparation.B, Comparison of two Gaussian curves, with means and variances corresponding to the measurements ofEGABA (thin line) and Veq (thick line). Note that there is a high degree of overlap between the two curves. The curves have been scaled so that their integrals are identical.

