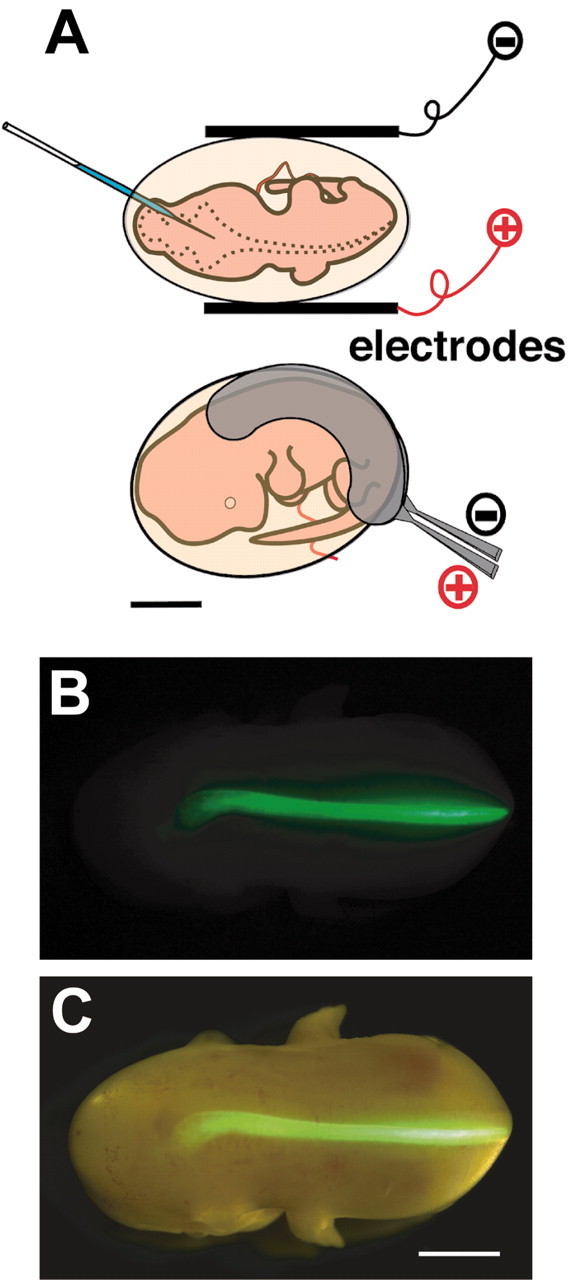
Fig. 2.

DNA transfer into the mouse spinal cord byin vivo electroporation. A, Schematic representation of DNA injection and electrodes. EYFP was introduced into the E11.5 spinal cord. B, Dorsal view of an embryo at E13.5, 2 d after electroporation. C, Semi-illuminated view of B. EYFP was expressed in only one side of the spinal cord closer to the anode. Scale bars: 2 mm.
