
Fig. 1.
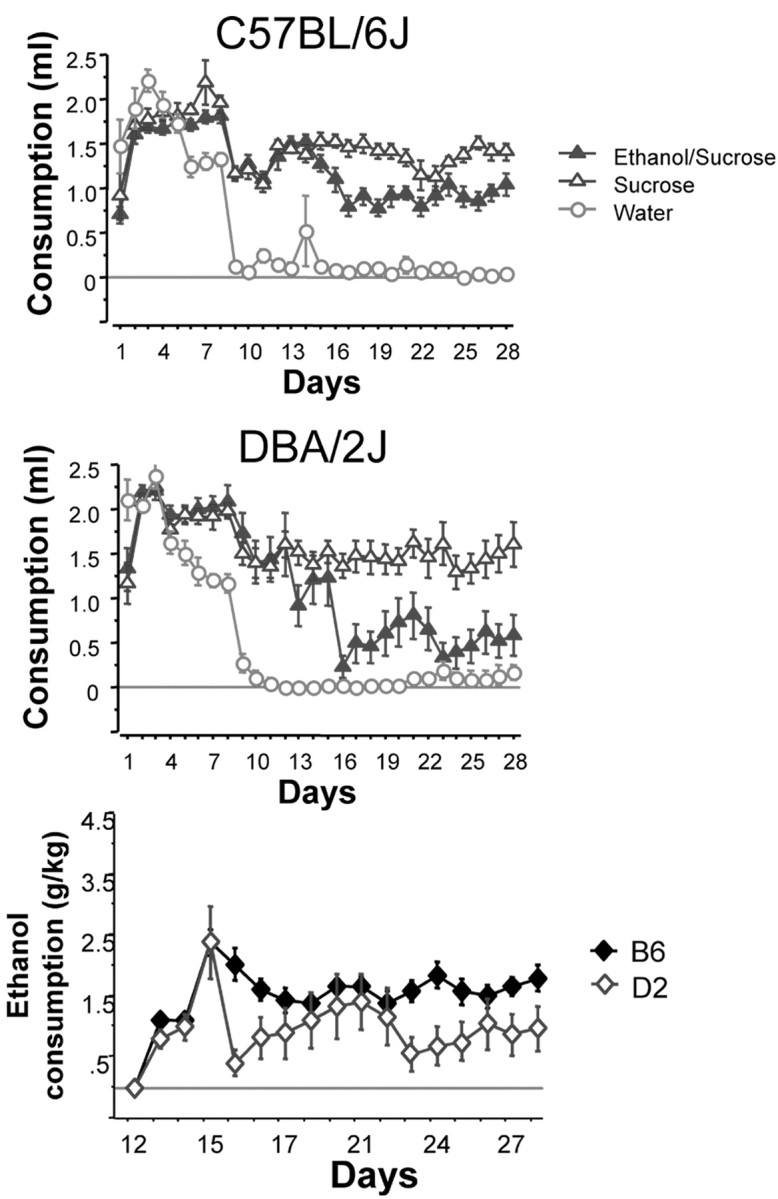
Consumption patterns of D2 (top) and B6 (middle) mice during the entire 30 min limited access procedure. On days 1–10, fluid access times were gradually decreased from 2 hr to 30 min during the test session. These changes were concurrent with gradual decreases in overall fluid deprivation (22 hr to 2 hr without access to fluid). On day 11, all mice except the water group were given 10% sucrose for 30 min. Alcohol was first introduced on day 13 at a 2% concentration in 10% sucrose, which was subsequently increased to 5% ethanol in 10% sucrose on day 15. Analysis of the significant group × strain interaction reveals differences between the strains in consumption levels of the ethanol/sucrose group (p < 0.001), but not sucrose or water. The bottom panel shows a strain comparison of ethanol consumption (grams per kilogram) during the 30 min limited access session. As expected, B6 mice consume more ethanol that D2 mice (p < 0.001).