
Fig. 3.
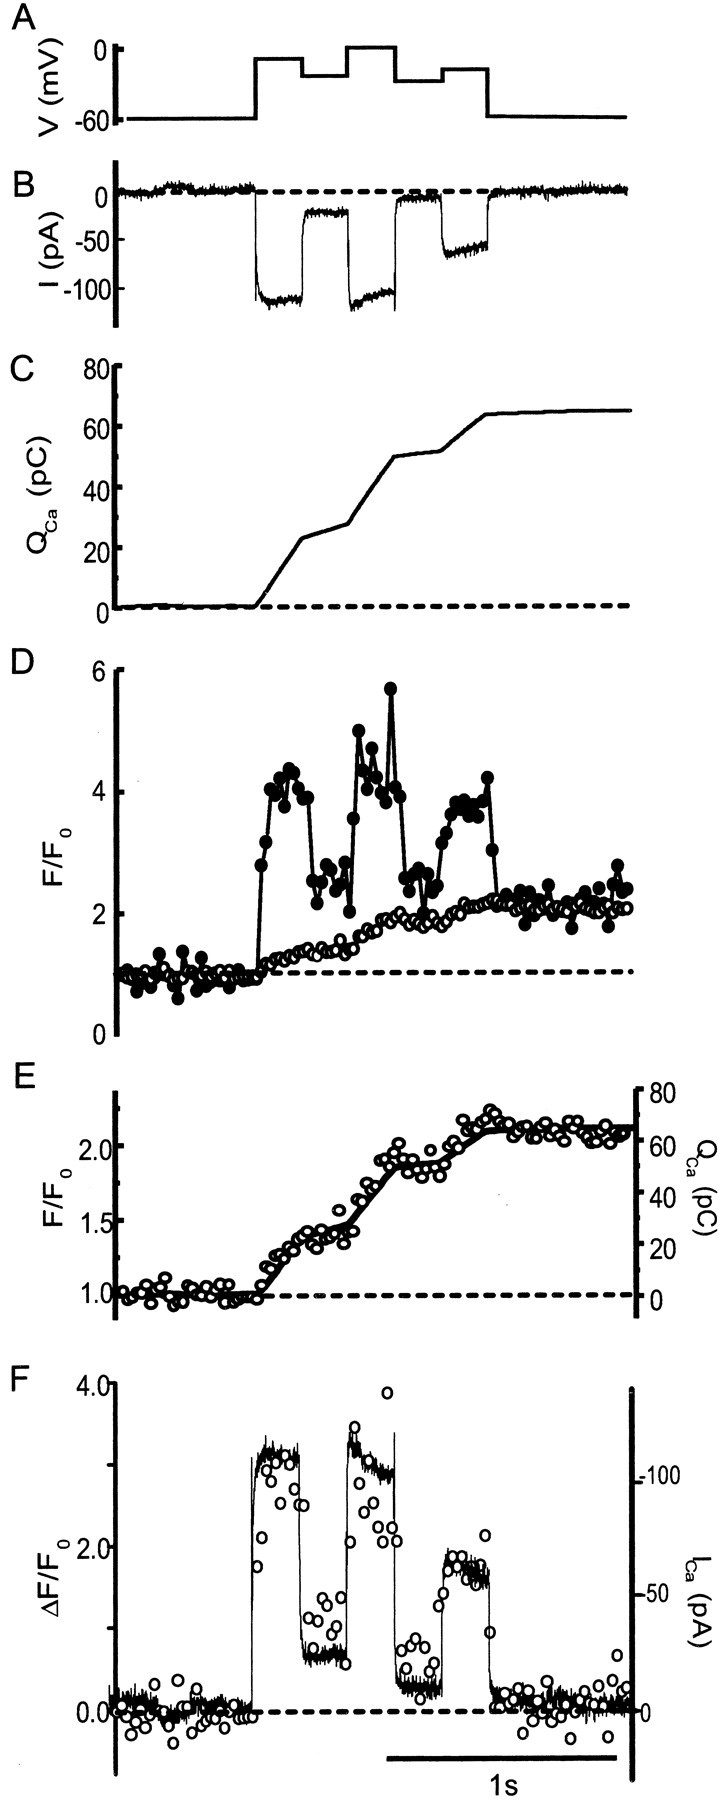
Fluorescence of hot spots as a component that tracks calcium current. A, B, Voltage (A) and leak subtracted (B) current. Because the cell was dialyzed with a Cs-glutamate-based internal solution designed to block potassium channels, the current reflects almost entirely calcium flux through L-type voltage-gated calcium channels (Heidelberger and Matthews, 1992; Tachibana et al., 1993). C, Time integral of the current inB (QCa). D, Fluorescence in a circle surrounding a hot spot (filled symbols) and in another circle in a quiet region of the cell (open symbols). Regions and cell are the same as in Figure 1, G and H. Fluorescence in the quiet region slowly increased while calcium entered the cell, whereas it responded more quickly to changes in calcium current in the hot spot. E, Fluorescence in the quiet region (open symbols) replotted with the integral of the calcium current (QCa) from C. F, Calcium current and fast component of fluorescence change in the hot spot. To estimate the fast fluorescence component, QCa was scaled and a constant was added so that values of the resulting trace were the same as the fluorescence of the hot spot (D,filled symbols) immediately before (averaged for 500 msec) and after (averaged for 500 msec) the series of voltage steps. The result was subtracted from the trace in D(filled circles). The open circles(left axis) show the result of this subtraction. The fluorescence rises and falls in proportion to the calcium current (right axis, solid line). Dashed lines indicate average values before depolarization.