
Fig. 2.
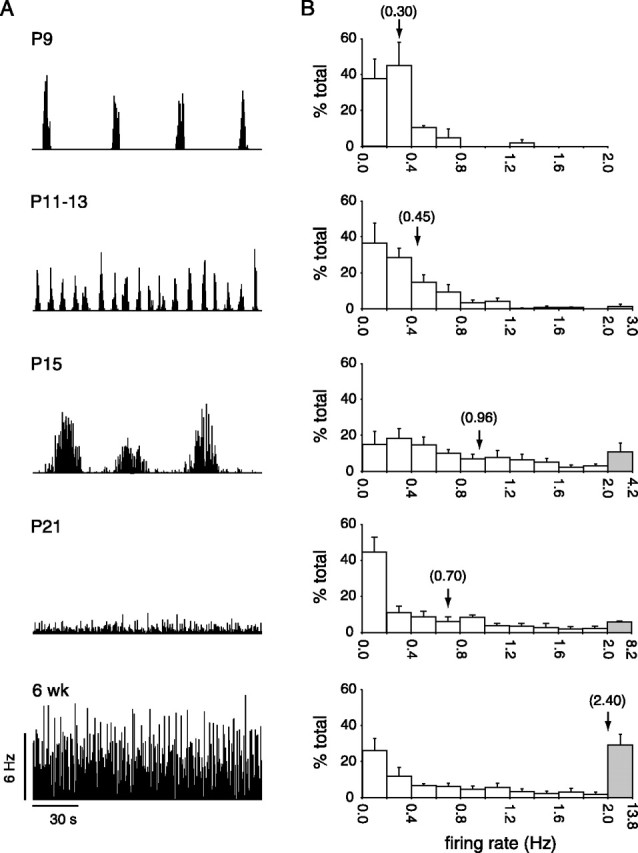
Changes in mean firing rate during postnatal development. A, Population firing rate of all cells (P9,n = 29 cells; P11, n = 35; P15,n = 39; P21, n = 20; 6 weeks,n = 38) from one retina at each age over 180 sec in 1 sec bins. B, Histograms of the distribution of mean firing rates of individual cells. Cells from different retinas at each age have been pooled. Each mean firing rate is binned into 0.2 Hz increments from 0 to 2 Hz, except for the last bin (coloredgray), which contains all firing rates between 2 Hz and the maximum value for that age. Error bars denote 1 SEM.Arrows indicate mean firing rate for each age with the numerical value shown in parentheses.