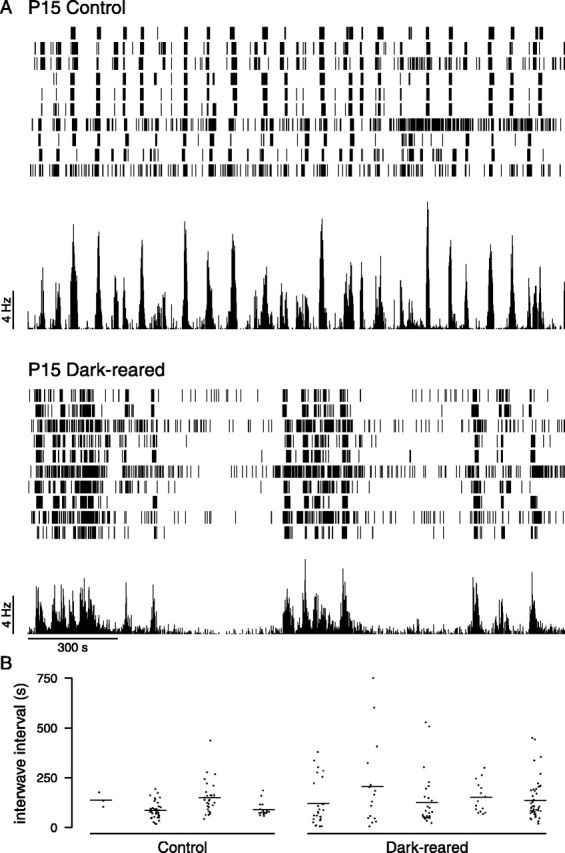
Fig. 6.

Effect of dark-rearing on spike trains at P15.A, Typical spike trains recorded from control and dark-reared retinas at P15 over 30 min. The mean firing rate of the population of cells is shown underneath the spike trains.B, The intervals between successive peaks in the population firing rate. The intervals are shown separately for four control retinas and five dark-reared retinas. Horizontal line indicates mean interwave interval for each retina.
