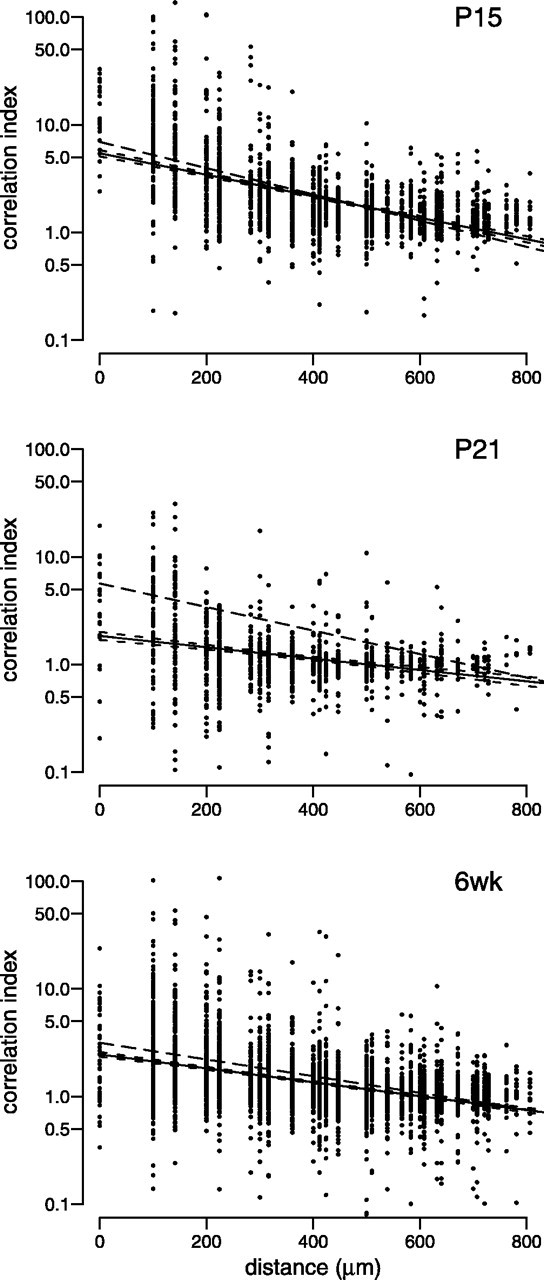
Fig. 9.

The effect of dark-rearing on the correlation index at different postnatal ages. Correlation indices plotted as for Figure 5. Number of cell pairs and retinas at each age are as follows:P15 (2078 cell pairs from n = 5 retinas), P21 (1267 pairs, n = 4), 6 weeks (6wk) (3613 pairs, n = 6). At each age, we show least-squares fits of the data to an exponential decaying function (solid line). Short dashed lines surrounding the solid line indicate the 95% confidence intervals of the fit. The means of the least-squares fit from the aged-matched control data (solid lines in Fig. 5) are plotted here in long dashed lines.
