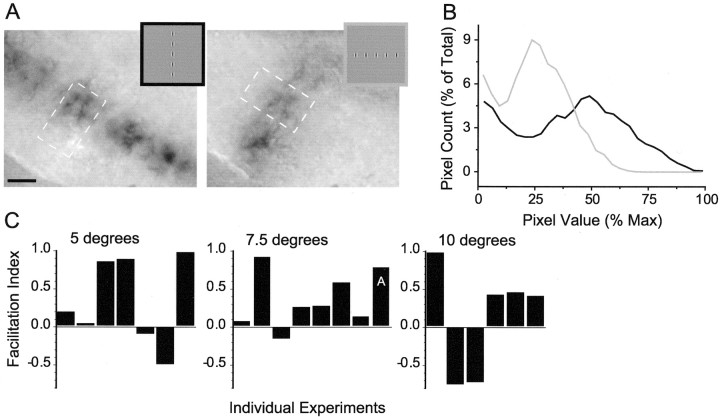
Fig. 10.
Facilitation of population response to collinear arrays of Gabor stimuli. A, Example of imaging;insets show stimuli (stimulus spacing represents 7.5°). Dashed boxes represent ROIs used for analysis. Scale bar, 1 mm. B, Histograms generated from the images in A. More pixels show greater activity (i.e., darker signal/higher values) for the collinear condition (black) than the orthogonal (gray) for this example. C, Comparison of collinear and orthogonal histograms with the use of the facilitation index reveals that for most experiments greater activity was observed for the collinear condition (positive value for the facilitation index) than for the orthogonal (negative value). Results are broken down by stimulus spacing; the facilitation index for the example shown inA is marked accordingly.

