Fig. 4.
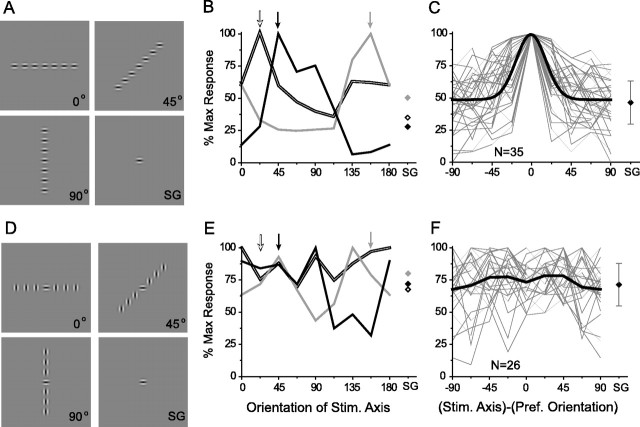
Collinear organization of summation fields in layer 2/3 neurons. A–C, Axis tuning assessed with iso-oriented Gabor stimuli. A, Example stimuli illustrating three of the eight axes that were tested and the single Gabor (SG) condition. B, Axis tuning for three sites. The arrows at the topindicate the preferred orientation for each site. Note correspondence between preferred orientation and peak of the axis-tuning curve for each site. Responses to SG stimuli are indicated bydiamonds on the right. Double line and black, Single units;gray, multiunit. C, Axis-tuning curves for all sites (thin gray lines) normalized to the preferred orientation of each site, with a Gaussian fit of the average tuning curve (black). Diamond atright, Average SG response (error bars ± 1 SD).D–F, Axis tuning assessed with cross-oriented Gabor stimuli. D, Examples of stimuli: a central Gabor of the preferred orientation surrounded by orthogonally oriented Gabors presented along different axes. E, Axis-tuning curves for the same sites illustrated in B showing a lack of orientation-specific axial facilitation. F, Axis tuning for all sites (thin gray lines) normalized to the preferred orientation. The black line represents average axis tuning; the black diamond depicts average SG response (error bars ± 1 SD).

