Fig. 6.

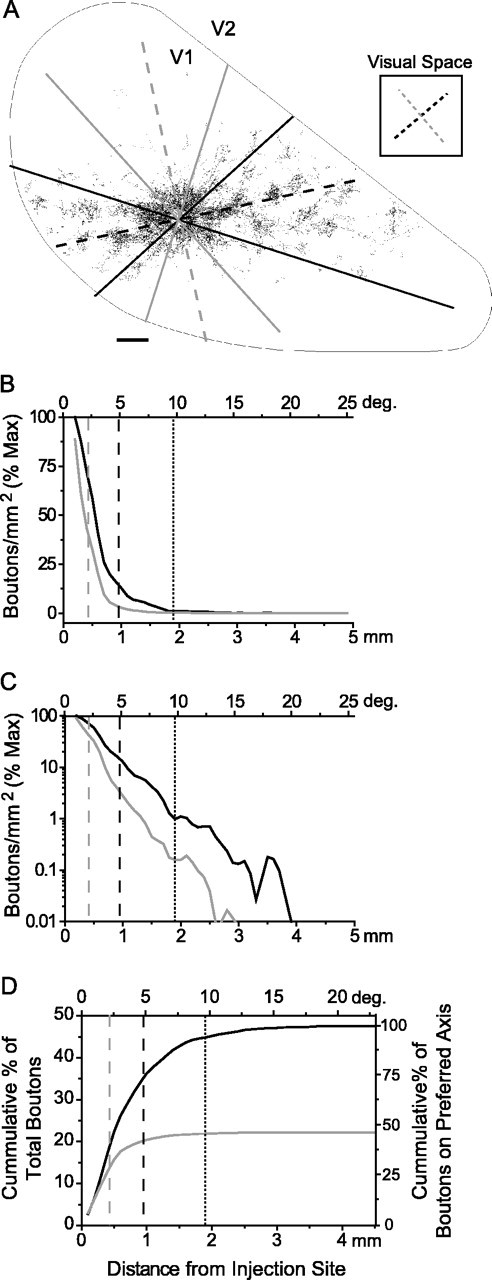
Horizontal connections in layer 2/3 and their relation to receptive field dimensions. A, A plot of labeled boutons within layer 2/3 of area V1 resulting from a biocytin injection into a site with an orientation preference of 40° (adapted from Bosking et al., 1997). The dorsal surface of V1 isoutlined, with the caudal pole to theleft, medial edge down, and V1/V2 border to the right. The axes of preferred (40°) and orthogonal (130°) orientation are indicated with blackand gray dashed lines, respectively, both in the icon of visual space to the right, and translated onto the cortical surface. Solid black and gray lines show the areas over which boutons were counted (± 30° from the two axes). Scale bar, 500 μm.B, Fall-off in bouton density with distance for the preferred (black) and orthogonal (gray) axes as a percentage of maximum density; distance is shown both in millimeters across cortex and degrees of visual space (average of 10 cases). C, The same data as plotted in B shown on a logarithmic scale to emphasize the extent of horizontal connections. D, The cumulative percentage of boutons measured along the preferred (black) and orthogonal (gray) axes (± 30°). Shown are average values for 10 experiments expressed as a percentage of total boutons (left axis) as well as percentage of boutons along collinear axis (right axis). In all graphs the dashed gray line indicates MDF width, the dashed black line indicates MDF length, and thedotted black line indicates the extent of the length summation field to 90% of asymptote.
