Fig. 7.
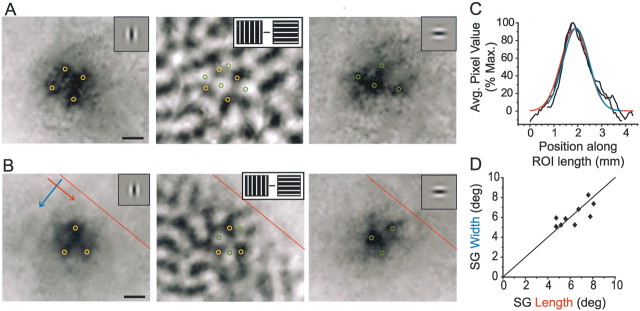
Population responses to SG stimuli display orientation specificity without anisotropic spread of activity.A, B, Intrinsic signal imaging of population responses to vertical (left panel) and horizontal (right panel) SG stimuli that were centered on the same location in visual space. Note the complementary distribution of activity peaks in these images (yellow and green circles) and their correspondence with dark and light regions, respectively, in the orientation difference map for the same region of cortex (middle panel). Scale bars, 0.5 mm. Images here and in subsequent figures are oriented such that caudal is leftand medial is down. The V1/V2 border is shown inred in B. C, Activity profiles along the length (axis of stimulus orientation) and width (orthogonal axis) of the SG response shown in the leftpanel of B (direction of activity profiles shown with colored arrows in B). The extent of activity along the two axes is very similar; raw profiles are shown in black, with Gaussian fits shown inred (length) and blue (width).D, Comparison of the extent of activity along the length and width of the SG responses (full width at half-height of Gaussian fits, as in C, converted to degrees) for nine experiments.

