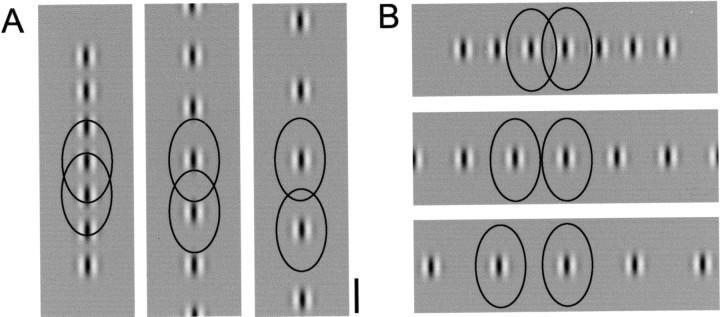
Fig. 8.
Distribution of horizontal connections relative to collinear and orthogonal stimulus configurations. The distribution of horizontal connections in visual space coordinates (black lines represent 10% density threshold; see Fig. 6) relative to the size and spacing of Gabor arrays used for optical imaging (5, 7.5, and 10° center to center). Because of the collinear bias in the arrangement of horizontal connections, there will be greater convergence of horizontal inputs for the collinear configuration than for the orthogonal configuration at all stimulus distances. Scale bar, 5°.

