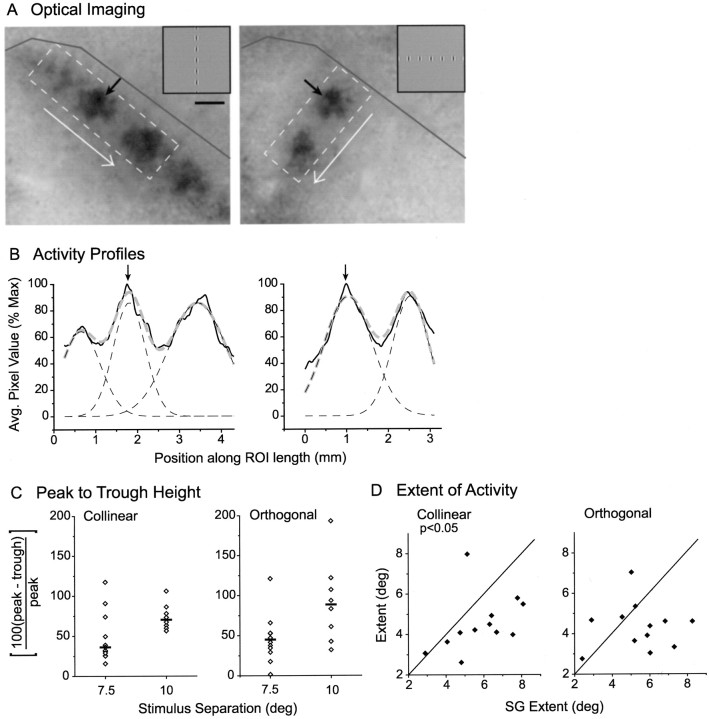
Fig. 9.
Population responses to collinear and orthogonal Gabor arrays display comparable spread of activity. A, Example of optical imaging of population response for collinear (left) and orthogonal (right) arrays (stimulus spacing = 7.5°). Black arrows point to the response associated with the Gabor stimulus common to both configurations. The dashed box defines a ROI used to create activity profile in the direction of the white arrow; a dark gray line marks the V1/V2 border. Scale bar, 1 mm. B, Activity profiles for images inA (black solid lines) were fit with a multipeak Gaussian (gray dashed lines) made up of component Gaussians that correspond to individual Gabor representations (black dashed lines); arrows point to the peak of the common Gabor response. C, Peak-to-trough heights for collinear and orthogonal stimulus configurations spaced at either 7.5 or 10°; black bars signify the median of each distribution. D, The extent of activity for a Gabor stimulus when that stimulus was a member of an array versus when it was present as a SG stimulus. Leftgraphplots the extent of activity along the collinear axis for collinear versus SG; rightgraph plots the extent of activity along the orthogonal axis for orthogonal versus SG. The full width at half-height of the relevant component Gaussian was used as the measure of extent.

