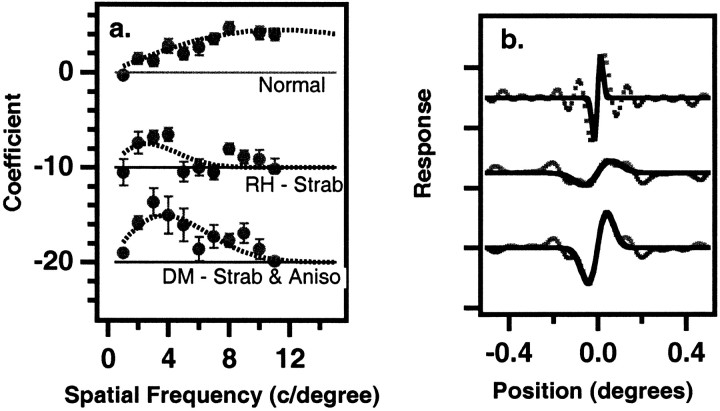
Fig. 2.
a, Classification coefficients for position (fixed offset = 90 arc sec). The 11 regression coefficients are plotted as a function of spatial frequency. Thesmooth curve is the two parameter derivative of a Gaussian (a blurred dipole) given by p1fexp(−p2f) that is best fit to the 11 data points. An additional datum at 30 c/degree with a value of zero was added to account for the expected falloff at very high spatial frequencies. Other details are as in Figure 1. b, Classification images for position (fixed offset = 90 arc sec). The dotted lines are the raw classification images averaged across normal and eyes and for the amblyopic eyes of two observers. The solid lines are the Fourier transforms of the blurred dipole curves fit to the regression coefficients in a. RH, Strabismic amblyope;DM, strabismic and anisometropic amblyope.

