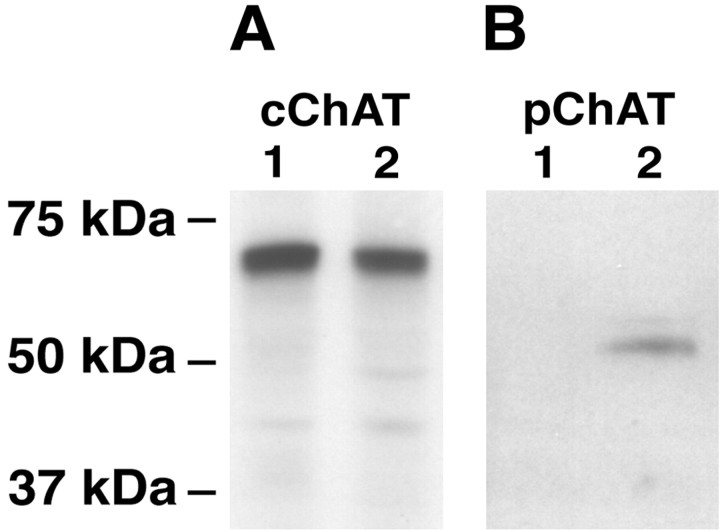
Fig. 6.
Western blot analysis using tissues of the striatum and colchicine-treated retina. A, Probed with the cChAT antibody. B, Probed with the pChAT antiserum.Lane 1, Striatum; lane 2, colchicine-treated retina. Note that the cChAT antibody reveals a 69 kDa band in the striatum and retina, whereas the pChAT antiserum detects a 55 kDa band in the retina but not in the striatum. The positions of the protein size markers (Prestained Precision Standards; Bio-Rad) are indicated to theleft.

