Fig. 1.
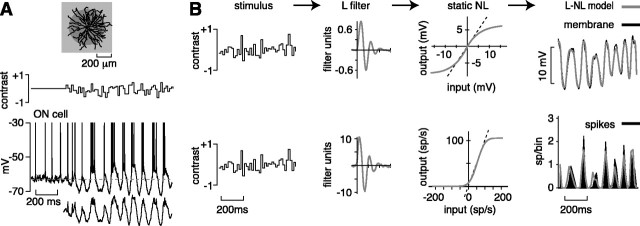
White noise stimulation and analysis.A, A spot covering the receptive field center of a cell modulated with intensities drawn from a Gaussian distribution (white noise; 16.7 msec frame). The top trace shows 300 msec of baseline response followed by 1 sec of white noise response. Thebottom trace shows the 1 sec white noise response after removing spikes and filtering (see Materials and Methods).B, An L–NL model was used to analyze the response to white noise. Stimulus is convolved with a L filter to generate an L model of the response. The L model is passed through a static nonlinearity to generate an L–NL model of the response. The L filter reflects the temporal sensitivity of a cell; the NL function reflects the contrast sensitivity of a cell (see Results). Analysis was performed separately for subthreshold voltages (membrane) and spike rate (spikes). For comparison with the L–NL model, membrane and spike traces are average responses to 20 repeats (averaged to reduce noise; 700 msec shown of a 5 sec stimulus presentation). Filter units are in millivolt contrast per second (membrane filter) or spike rate contrast per second (spike filter). sp, Spikes.

