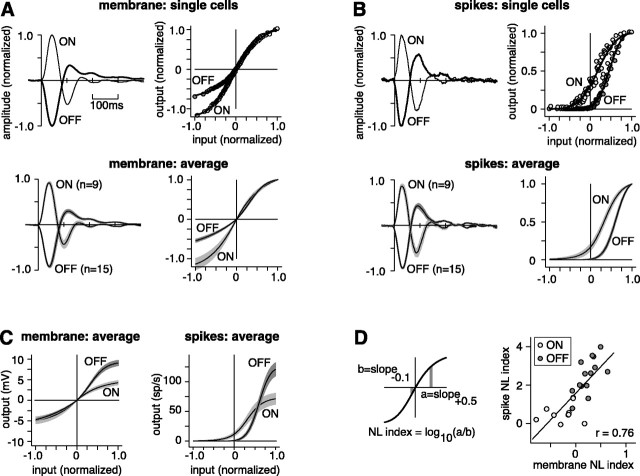
Fig. 2.
Relative to an ON cell, an OFF cell receives more rectified synaptic input and transmits more rectified spike output.A, Membrane L filter and NL function for representative cells and the populations. The NL function of the ON cell reaches positive and negative amplitudes of similar extents, whereas that of the OFF cell reaches a maximum negative amplitude that is only half the maximum positive amplitude (i.e., rectification). For the L filter, response amplitude is normalized to the peak of the primary lobe (+1 for ON and –1 for OFF). For the NL input–output function, input is normalized from –1 to + 1; output is normalized so that the predicted response at 0 contrast is 0, and the maximum depolarization is 1. For single-cell NL functions, circles represent binned data points; the solid line represents a fit (see Materials and Methods). The shaded area around the average NL function represents ±SEM. An ON cell was slightly but significantly more biphasic (amplitude of peak to undershoot) than an OFF cell for both spike and membrane responses (p<0.05). B, Same format as in A for spikes. At low contrast (i.e., small values of input), an ON cell is nearly linear, whereas an OFF cell is strongly rectified. For both an ON and OFF cell, the spike L filter was more biphasic than the membrane L filter (p <0.01), consistent with high-pass filtering (Lankheet et al., 1989; Demb et al., 2001b).C, Population NL input–output functions plotted with raw response amplitudes (output). For both membrane and spikes, an OFF cell expresses a wider response range than an ON cell (p < 0.01). D, For both membrane and spikes, the NL index was significantly higher for OFF cells (p < 0.001). The scatter plot illustrates a significant correlation between the membrane and spike NL indices (p < 0.01). NL index of0 indicates a linear response.

