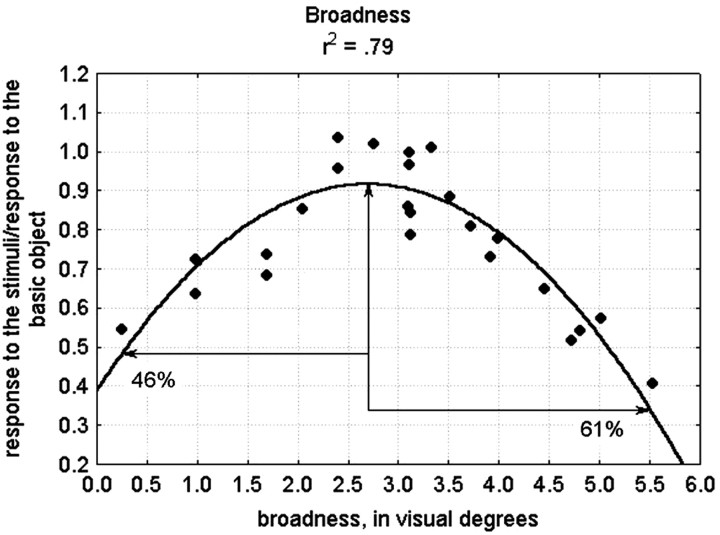
Fig. 11.
Unidimensional quadratic fit for one neuron based on broadness. The maximum of the function and the two points at the extremes of our sample range are indicated with arrows. The absolute difference between the response at the left extreme and the maximum response is 46% of the maximum response, and the absolute difference between the response at the right extreme and the maximum response is 61%.

