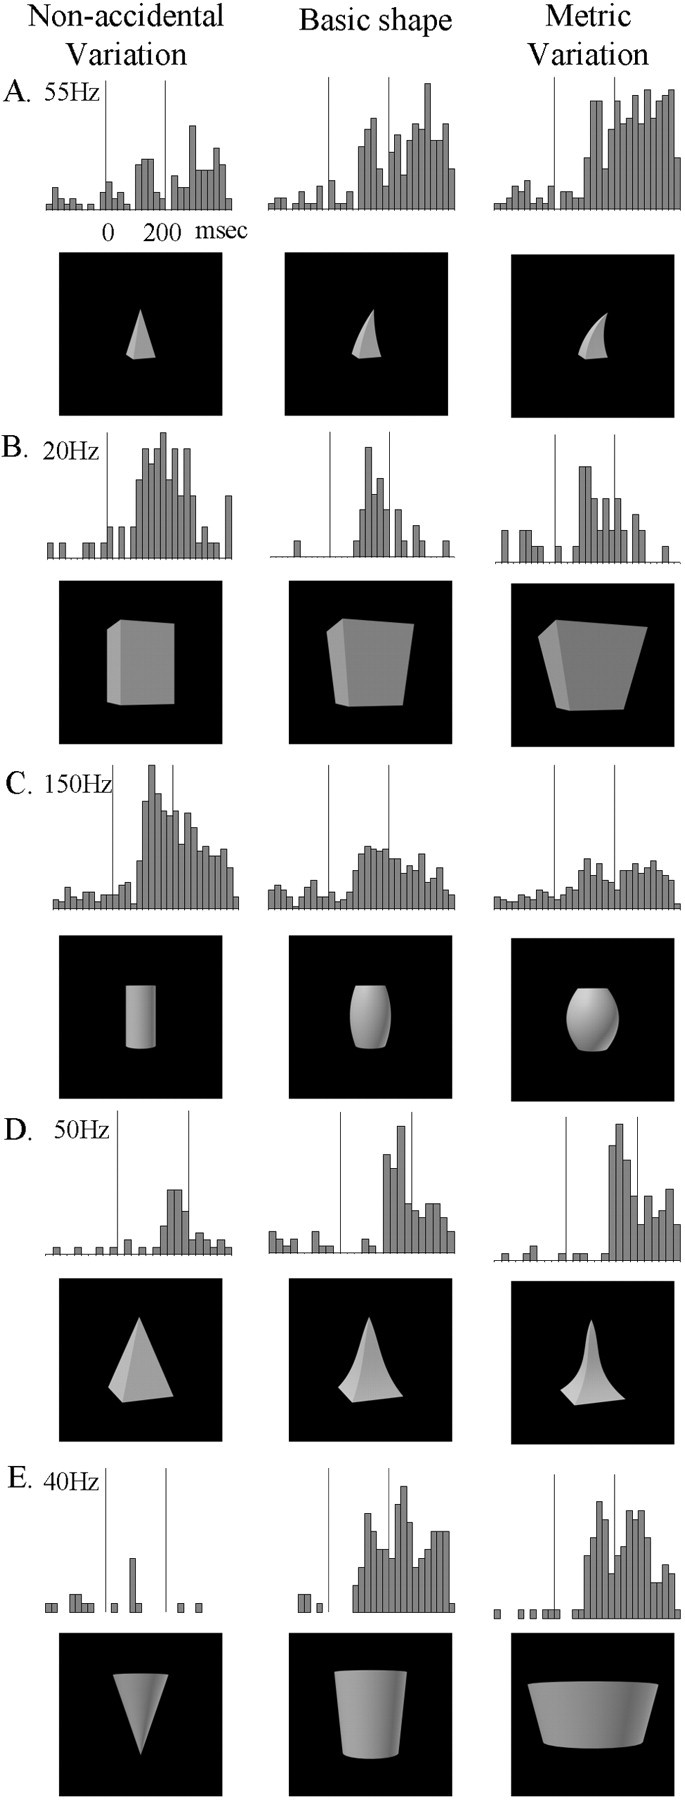
Fig. 3.

Responses of five single IT neurons to the basic object (middle), the NAP variation (left), and the equally large MP2 variation (right). A–D, Comparisons each situated on a single GC dimension within a row, but different dimensions between rows, the dimensions being (A–D, respectively) curvature of the main axis, expansion of the cross section, positive curvature of the sides, and negative curvature of the sides. In comparison E, the NAP and MP variations are situated on separate GC dimensions, the NAP change being the cross-section ending in a point versus the cross section ending on a side and the MP change being a change in aspect ratio. The vertical lines on the poststimulus time histograms indicate the stimulus onset and offset. The stimulus duration was 200 msec (see time scale oftop left histogram). Bin width is 20 msec.
