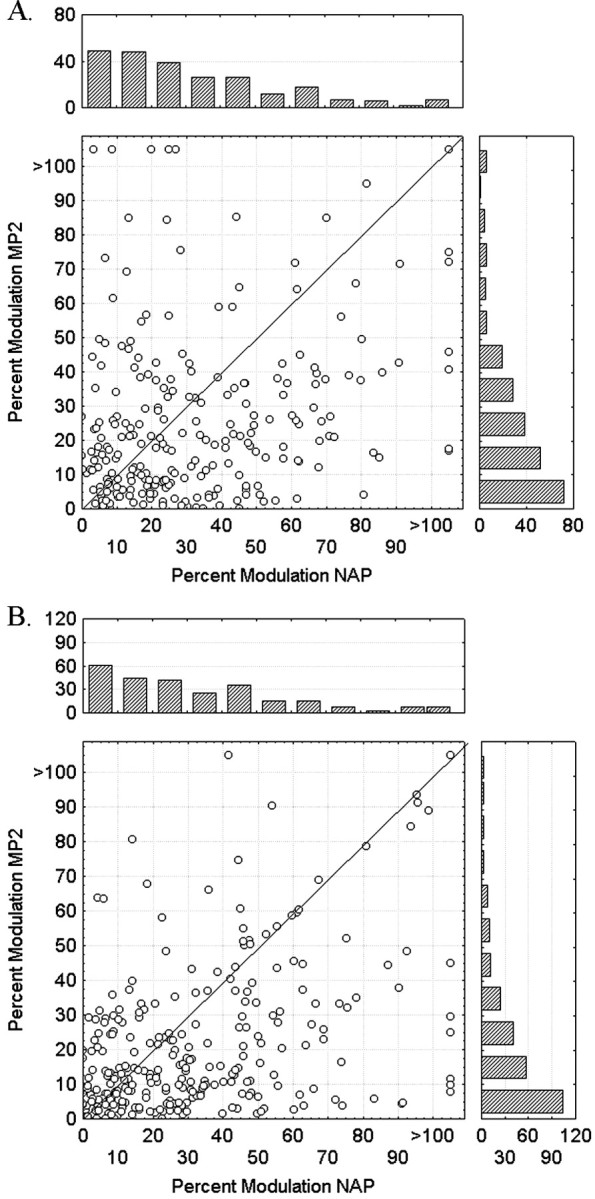
Fig. 5.

A, Frequency distributions and scatter plot of the response modulations for all intradimensional NAP–MP2 comparisons (n = 243, 162 neurons).B, Frequency distributions and scatter plot of the response modulations for all cross-dimensional NAP–MP2 comparisons (n = 268, 121 neurons).
