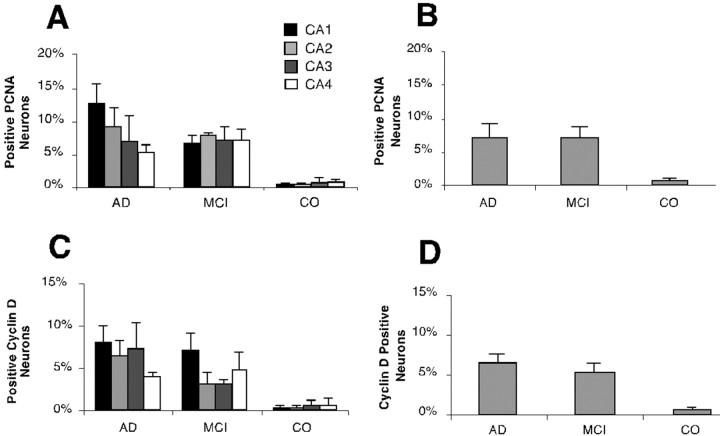
Fig. 7.
Percentages of immunopositive neurons stained with cell cycle markers in the hippocampus of MCI, AD, and control. Cells were scored for the presence of cell cycle proteins as described in Materials and Methods. Because the anatomical position of the sections scored varied from case to case, all results were expressed as “percent positive” neurons. The results for PCNA (A, B) and cyclin D (C, D) are shown separately. For each case an attempt was made to count percentages in four CA fields separately (A, C). There will be inaccuracies in these estimates as discussed in Results. The percentages of the entire hippocampal pyramidal cell population are also reported (B, D). In A andC, the percentage for CA1 is shown inblack, CA2 is shown in dark gray, CA3 is shown in light gray, and CA4 is shown inwhite. Values shown are means of the percentages calculated in each case; the error bars represent SEs.

