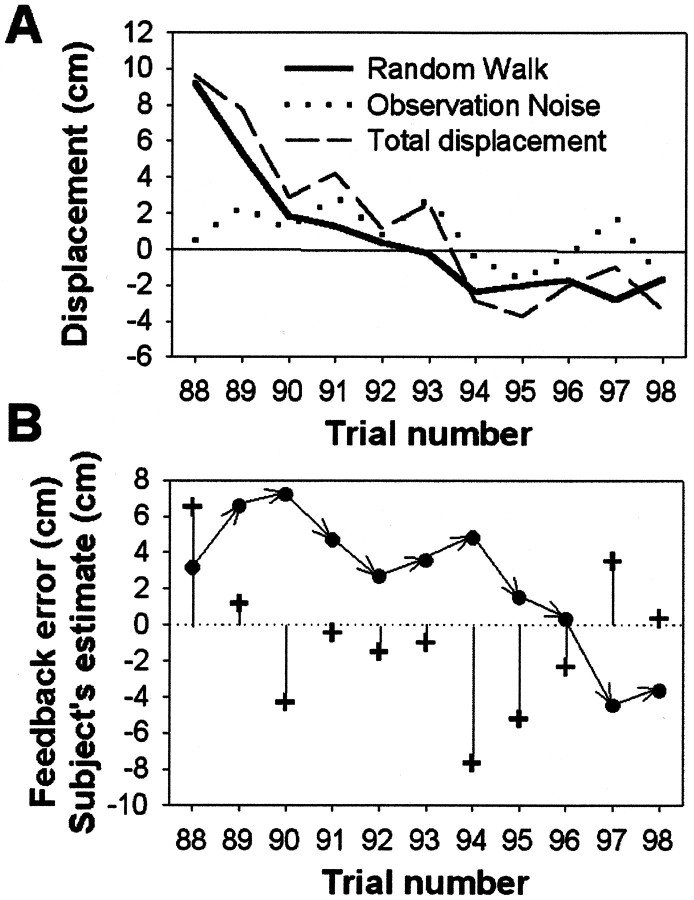
Fig. 2.
Typical displacement data and one subject's estimation of the displacement. A, Typical random walk values Wt over 11 trials are indicated by thebold solid line. Observation noise Nt(dotted line) was then added to Wt to give the total added displacement Dt(dashed line). Note how Wt is correlated with Wt−1, whereas Nt is uncorrelated from trial to trial.B, The same set of trials as in A showing the feedback error, Pt − Tt (+) and the subject's estimate of the displacement or Tt − Mt, (●) for each trial. Note how the subject adjusts her estimate of the displacement over succeeding trials in response to the feedback error. These data are from one of the high-drift, medium-noise sessions (ςN = 1.5 cm; ςW= 1.5 cm).

