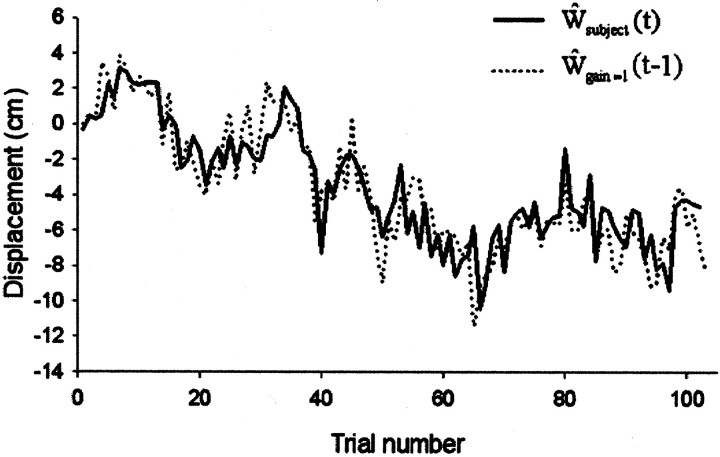
Fig. 3.
Typical data from a complete run of 102 trials in the high-drift, medium-noise condition (ςN = 1.5 cm; ςW = 1.5 cm). Here the subject's estimate (dotted lines) is shown against the actual displacement data (solid line). To emphasize the relationship between subject response and previous error, the displacement data curve has been displaced to the right by one trial. It therefore represents the performance of a system (Model 1) that estimates the displacement on trial t from the error observed on trial t − 1.

