Fig. 2.

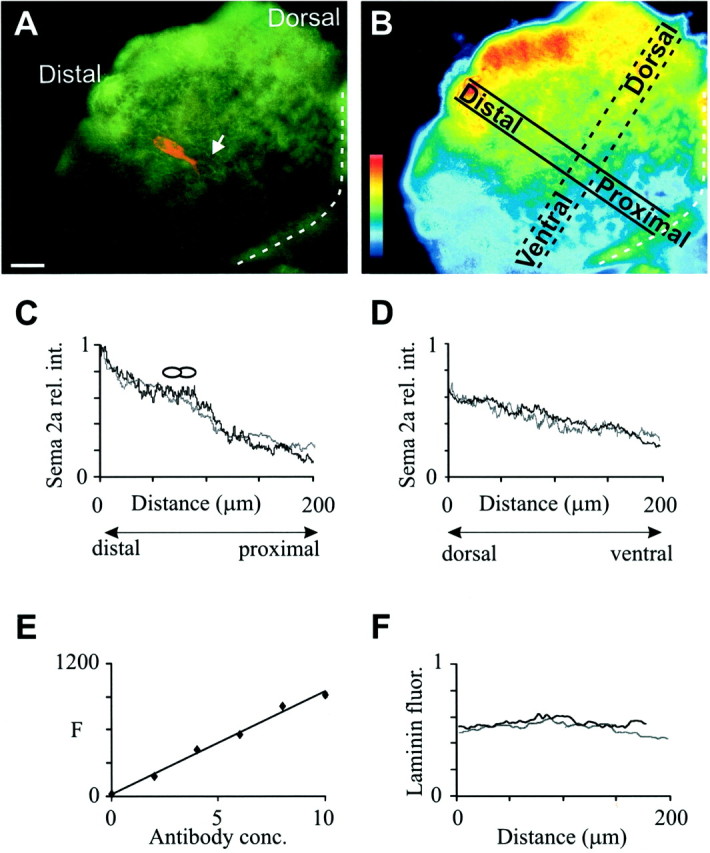
Analysis of Sema 2a gradient.A, A representative wide-field image of a double-labeled limb fillet at ∼31% embryonic development. The Ti1 growth cones (arrow) have just emerged from their cell bodies and are extending toward the trochanter. The dashed line denotes the proximal boundary of the filleted limb. B, A pseudocolored image of the same fillet shown in A, illustrating the orientation of the distal–proximal and dorsoventral line scans. C, Distal–proximal gradient: relative intensity (rel. int.) profiles of Sema 2a immunoreactivity. The same limb fillet was imaged with wide-field (gray line) and confocal (black line) microscopy. The location of the cell bodies is denoted byovals. D, Dorsoventral axis: relative intensity profiles of Sema 2a immunoreactivity. The same limb fillet was imaged using wide-field (gray line) and confocal (black line) microscopy. E, Linear relationship between fluorescence intensity [arbitrary fluorescence units (F)] and fluorescent antibody concentration (in microliters per milliliter). F, Intensity profile of laminin immunoreactivity along the distal–proximal axis (gray line) and the dorsoventral axis (black line), scaled to Sema 2a fluorescence intensity. Scale bar, 30 μm.
