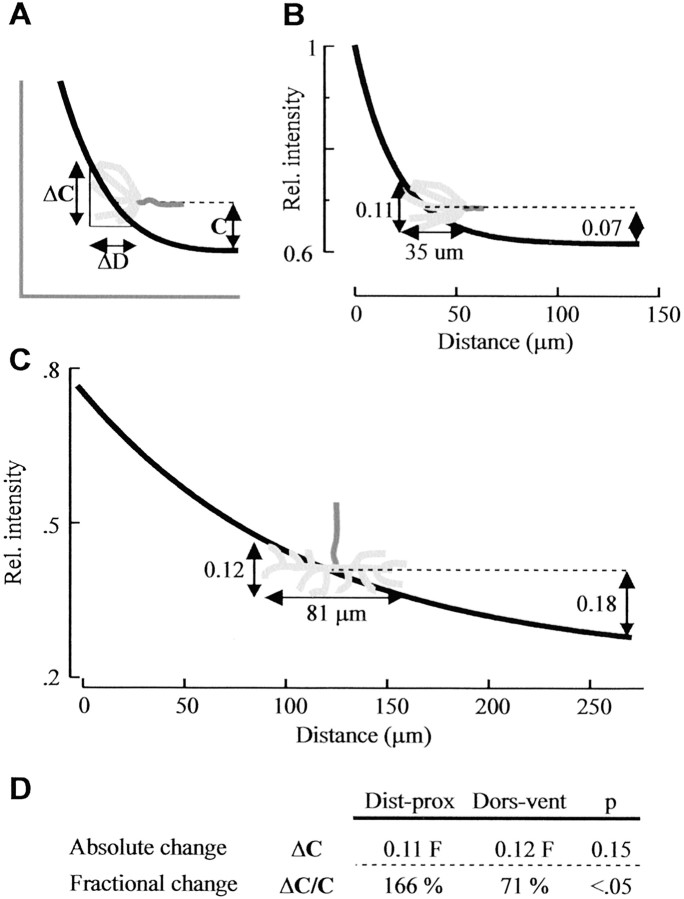
Fig. 7.
Ti1 pioneer growth cones detect the steepness of the Sema 2a gradients using a fractional change mechanism.A, Illustration of the fractional change and the absolute change gradient-reading mechanisms. ΔCindicates the absolute change in ligand concentration across the growth cone. C indicates the average ligand concentration detected across the growth cone, where 0 is the baseline concentration for the gradient (depicted as a dashed line). ΔC/C indicates the fractional change in ligand concentration across the growth cone. ΔD is the distance the growth cone spans along the gradient. ΔDvaries during development, because the Ti1 growth cone expands with proximal migration toward the trochanter. B, At 31.5% development, the young Ti1 growth cone (depicted ingray) spans an average distance of 35 μm along the distal–proximal gradient. The absolute change (ΔC) equals 0.11 relative intensity (Rel. intensity), and the fractional change (ΔC/C) equals 166% of the average concentration sampled by the growth cone. C, By 33% development, the growth cone (gray) has contacted the Tr guidepost cell within the trochanter and has increased in average size to 81 μm along the dorsoventral gradient. Within the trochanter, the absolute change (ΔC) equals 0.12 relative intensity, and the fractional change (ΔC/C) equals 71%.D, Table comparing absolute change and relative change in Sema 2a levels across the typical Ti1 growth cone at the two limb positions. Absolute change in Sema 2a levels across the growth cones is similar at the two decision points (p = 0.15; t test). In contrast, fractional change in Sema 2a levels across the growth cone is markedly different at the two positions (p < 0.05).Dist-prox, Distal–proximal; Dors-vent, dorsoventral.

