
Fig. 7.
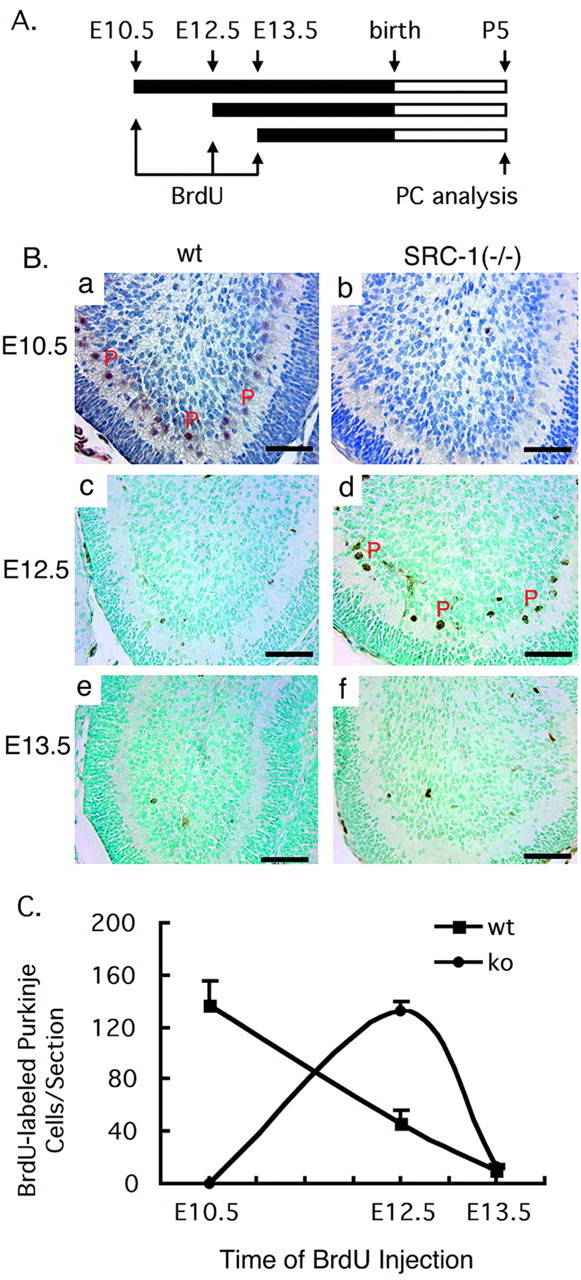
Delayed generation of Purkinje cell precursors.A, Time course for treatment and analysis. Precursor cells were labeled by injecting a single dose of BrdU into multiple pregnant SRC-1+/− females at 10.5, 12.5, and 13.5 d.p.c. Cerebellum samples were obtained at P5 for analysis of BrdU-labeled Purkinje cells (PCs). B, The nuclei of BrdU-labeled PCs on the midsagittal sections of cerebella were identified by immunostaining with an antibody specific to BrdU. After antibody reactions, the slides were counterstained either with hematoxylin (a, b) or with methyl green (c–f). Note that BrdU-positive PCs, indicated byP, were observed primarily at E10.5 for WT mice (a) and at E12.5 for SRC-1−/− mice (d). Scale bars, 50 μm. C, Quantitative analysis of BrdU-labeled PCs. BrdU-labeled PCs on three adjacent midsagittal sections prepared from each cerebellum at P5 were counted. Each average number of BrdU-labeled PCs per section for each genotype and each time point was calculated from a total of 12 sections, which were prepared from four mice. When BrdU was given at E10.5 (10.5 d.p.c.), the number of BrdU-labeled PCs at P5 in WT mice was significantly higher than in knock-out (ko) (SRC-1−/−) mice (p < 0.001; t test). However, when BrdU was given at E12.5, the number of BrdU-labeled PCs at P5 in WT mice was significantly lower than in knock-out (SRC-1−/−) mice (p < 0.001; t test). There were no statistical differences between two groups when BrdU was given at E13.5.