
Fig. 5.
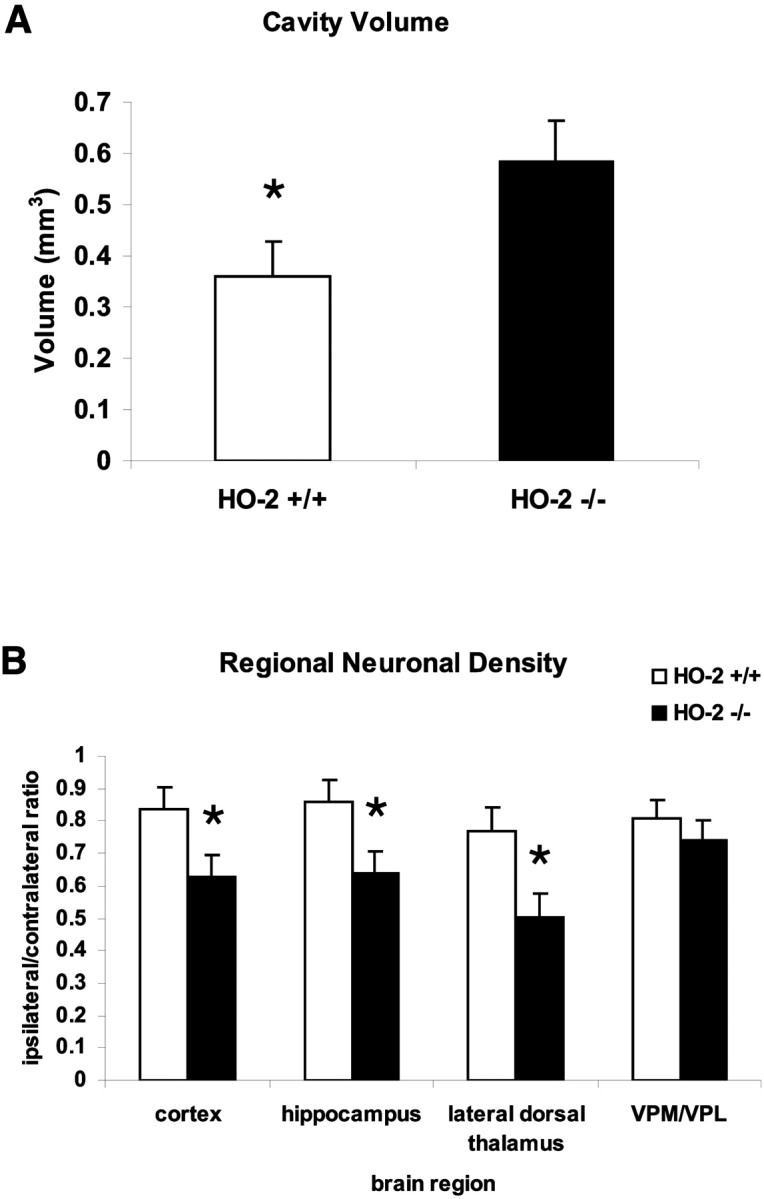
Cell loss after traumatic brain injury.A, Volumetric measurements of cortical cavity on histologic sections. Values are shown as the mean ± SEM (*p ≤ 0.05; unpaired t test).B, Regional neuronal density by NeuN cell counting in adjacent cortex, hippocampal CA3, lateral dorsal thalamus, and medial/lateral ventroposterior nuclei of thalamus. Values are shown as the mean ± SEM (*p ≤ 0.05; unpairedt test).