
Fig. 3.
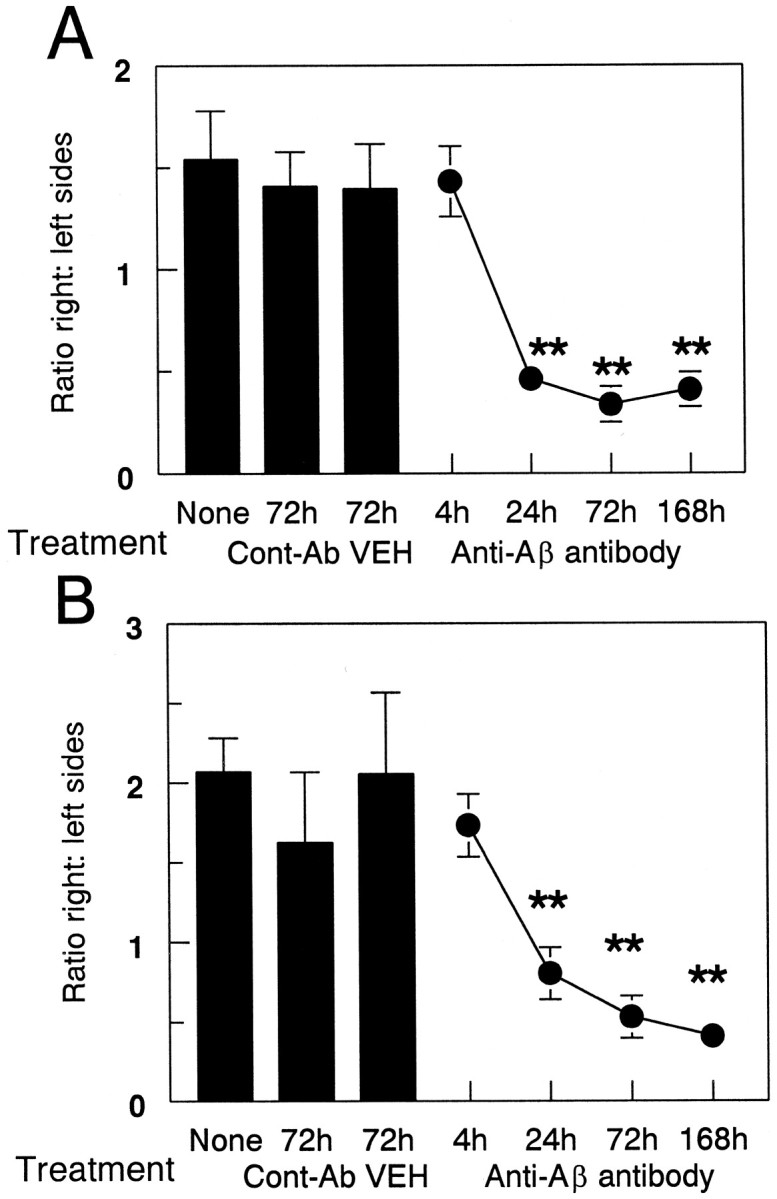
Quantification of reduced Αβ load after anti-Αβ antibody injections. Data are expressed as the ratio of Aβ staining in the injected hemisphere to the control hemisphere. The three bars on the left indicate the Αβ load in the untreated group (None) and the vehicle (VEH) and anti-HIV antibody (Cont-Ab) groups at 72 hr. The line shows the ratio of Αβ immunohistochemical staining at 4, 24, 72, and 168 hr survival times. Reduced Αβ load was observed in the frontal cortex (A) and hippocampus (B) at 24, 72, and 168 hr compared with 4 hr and both control groups (**p < 0.005).