
Fig. 6.
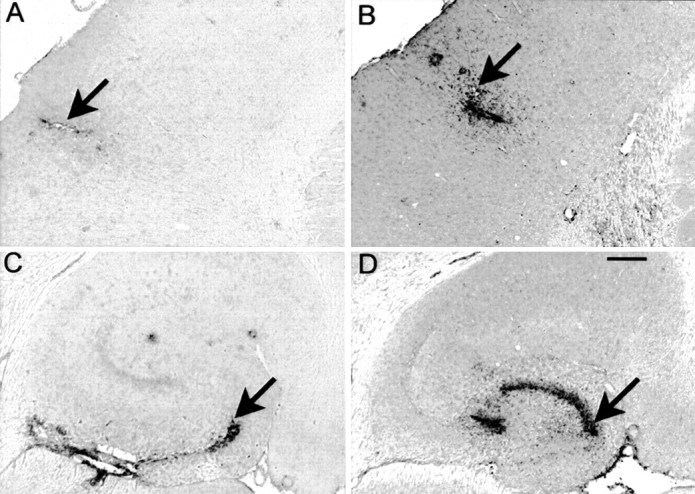
CD45 immunohistochemistry is increased 3 d after anti-Αβ antibody injections. CD45 immunohistochemistry is shown in frontal cortex (A, B) and hippocampus (C, D). Mice inA and C received control antibody, whereas those in B and D received anti-Αβ antibody. Magnification, 40×. Scale bar, 120 μm. Arrows indicate the site of injection identified from the needle tract. A high-resolution color version of this micrograph can be obtained by e-mail from D. Morgan (dmorgan@hsc.usf.edu).