
Fig. 3.
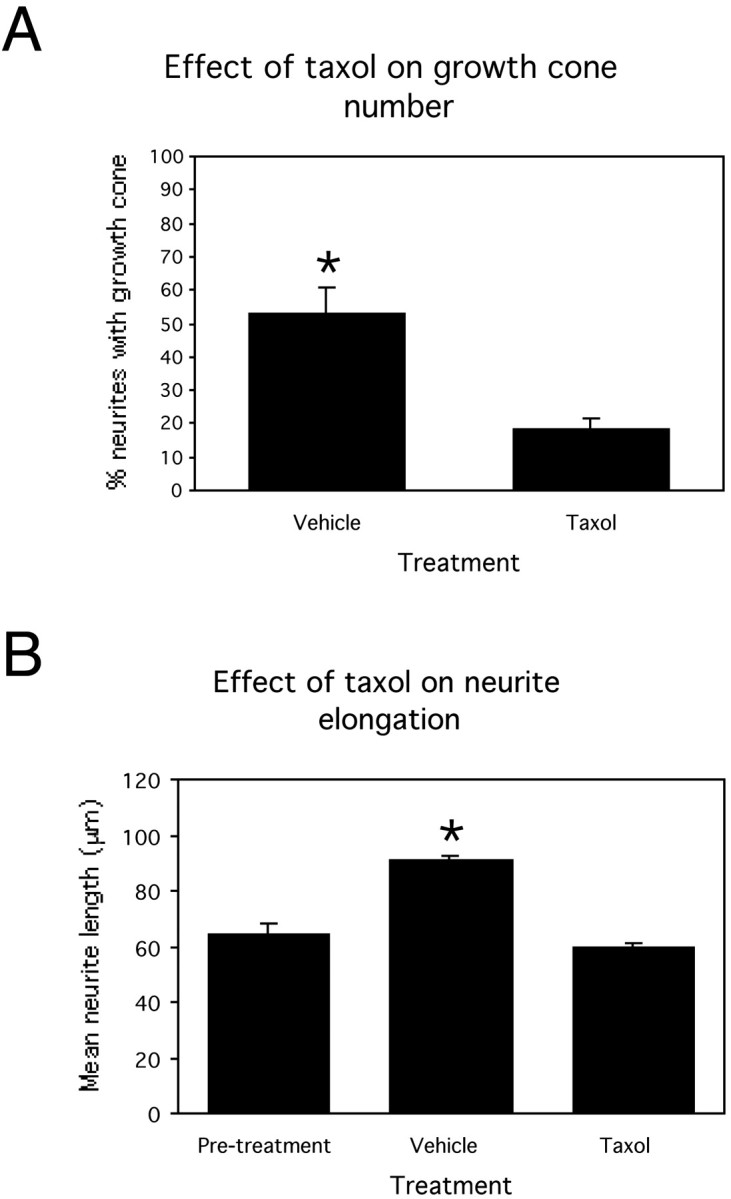
Bar graphs showing the effect of exposing developing cortical cultures to vehicle or taxol for 48 hr between 3 and 5 DIV. A, Proportion of neurites tipped by a growth cone after 48 hr vehicle or taxol treatment. B, Mean neurite length before treatment and after vehicle or taxol treatment. *p < 0.05. Error bars are SEMs.